Measured by NuaSense weather stations and soil probes on Kenyan farms, over the period stated with each figure. Past readings, not a forecast.
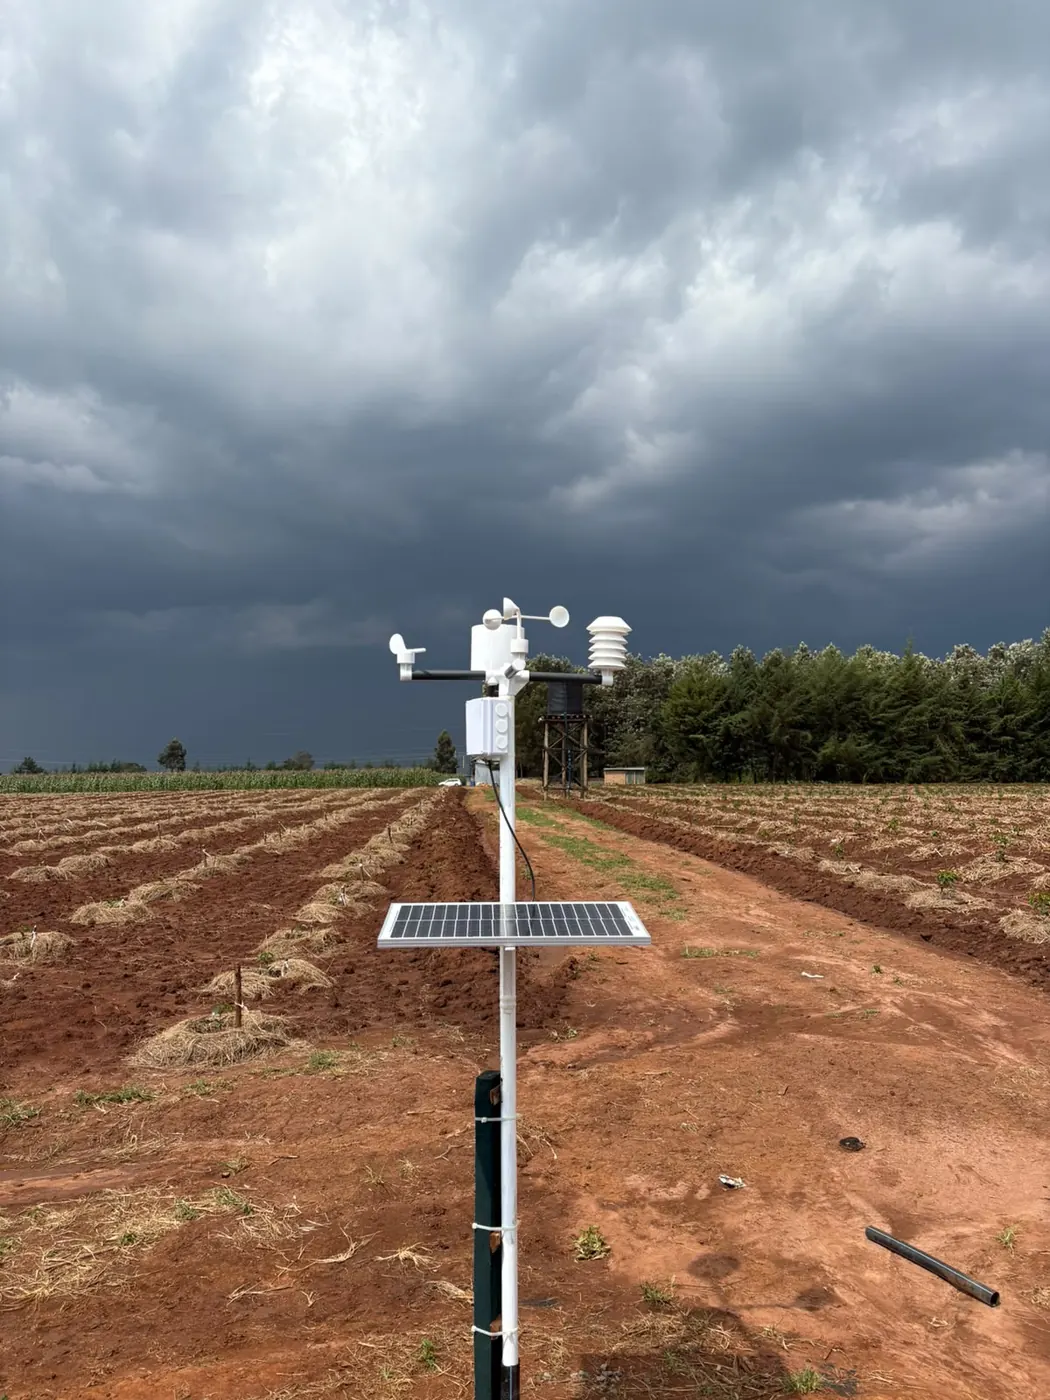
A normal reading, and a bed that looks dry
Stick it in the ground, watch the number, water when it falls past the line. Most probes ship with that advice. On a Kenyan block it falls apart in the first dry week. The phone shows a reading inside the band our own probes call normal, 60 to 85 percent of sensor scale, while the top leaves are curling by late morning. Soil moisture sensor accuracy is the question sitting under that argument. Nobody answers it, because the figure on the screen carries no error bar.
It should carry one. Nothing in the ground counts water molecules. A probe reads an electrical property and infers water from it, and a curve drawn somewhere else turns that property into a moisture figure. What follows works back through the assumptions behind the simple advice and puts a size on each error where a published trial allows it. Where no trial allows it, this piece says so. An honest gap is more use to a grower than a confident guess.
Four hundredths of a cubic metre, on a good day
Start with the best case: a mineral soil, a calibrated sensor, a laboratory. A Michigan State University study of a low-cost handheld sensor calibrated it on 408 samples from 83 locations. For mineral soils it reported a root mean square error of 0.035 m3/m3, with bias under 0.001 m3/m3 and a correlation of 0.90 against oven-dried samples. That same paper notes that popular commercial instruments, HydraProbe, ThetaProbe and TDR 100, carry reported errors of less than plus or minus 0.04 m3/m3. The cheap sensor agreed with the two commercial handhelds at a correlation above 0.90. Cheap and dear sit in the same error band, in that soil, on that day.
Those figures sound small. Translate them. An Oregon State extension guide on soil moisture monitoring gives a worked example: a volumetric water content of 0.25 cm3/cm3 through a 12-inch root zone stores 3 inches of water. An error of 0.035 on a true value of 0.25 is 0.035 divided by 0.25, which is 14 percent of the water you think is there. On the Oregon example that is 3 inches times 0.14, or about 0.42 inches of stored water that may or may not exist. Everything was done right, and a seventh of the water budget is still in doubt.
Now put two probes in the same bed, each within the 0.04 band, one erring high and one erring low. They can disagree by 0.08 m3/m3 while both sit inside specification. A grower who sees two units diverge has not necessarily bought a faulty one. Soil-specific calibration in the Michigan paper only trimmed the error to 0.031 for loam and 0.034 for sandy loam, a small gain for a lot of laboratory work. Here is the uncomfortable part. On a plain mineral soil the method itself sets the floor of the error, and no calibration drives it to zero. Whether the probe is exact was never the question. The question is whether your decision has room for a tenth or more of the water budget to be wrong, and most of the rest of this piece sorts decisions into those that do and those that do not.
Everything above is the lab case. Field conditions widen the band, and the next sections take the widening one cause at a time: the soil the curve was drawn in, salt, the arithmetic of water use, placement, heat and drift. Each one has a direction, and knowing the direction is most of the defence.
The curve was drawn in sand or loam, far from your field
A factory curve has an origin. A Chinese salinity trial of eight sensors in the PMC journal archive states plainly that factory calibration is usually done with homogeneous sand or loam under standard laboratory conditions. That one sentence explains most of the complaints a Kenyan agrovet hears about probes. A customer's soil is not homogeneous sand. It is a volcanic clay, a sandy loam over a stone line, or a bed that has had years of manure dug into it.
Organic matter is the case the Michigan study measured directly. In forest organic soil the low-cost sensor's error rose to 0.078 m3/m3 and the correlation fell to 0.80, more than double the mineral-soil error from the same instrument. Organic material holds water in a different structure and behaves differently to the probe's signal, so a mineral curve maps it wrongly. For a Kenyan grower the transfer is this: a probe in a heavily composted greenhouse bed or a coir bag is in a different calibration case from the same probe in the open field. That trial was in a North American forest, not a Kenyan coir bag, so the exact figure does not carry over. Its direction does.
There is a University of Arizona guide to maintaining and calibrating field sensors that names three more soils where standard calibrations often go wrong: sandy, clay and calcareous. Arizona is hot, dry and variable, and the guide calls for calibration by site, texture, bulk density and salinity. Look at its bulk density ranges: about 1.4 to 1.7 g/cm3 for sandy soils, 1.2 to 1.5 for loams and 1.0 to 1.3 for clays. Those ranges show how much the mass around the electrodes can change for the same volume. A curve has no way of knowing which soil it has been pushed into. Kenya has all three soil classes, and nobody has written a Kenyan version of that guide.
Salt pushes the number up before any water arrives
Salinity is the error that creeps up on you. That PMC trial ran eight common sensors, EC-5, 5TE, Teros12, Hydra-probe II, TDR315L, TDR315H, TDR305H and CS655, through four salinity levels given as EC 1:5 of 3.0, 1.5, 1.0 and 0.75 dS/m, at six moisture levels. Salt made the sensors overestimate, and the overestimate grew as salinity rose. The reason is that dissolved salt gets in the way of electromagnetic wave transmission, causing dielectric losses that the probe reads as extra water. To a probe, salt looks wet.
The sensors did not fail in the same way. At EC 1:5 of 3.0 dS/m, the TDR315L, TDR315H, Hydra-probe II and 5TE showed what the authors call mutational distortion: a sudden break in the response. Teros12 and TDR305H went the other way at that level and turned insensitive. At 1.5 dS/m the insensitive group widened to take in 5TE and Hydra-probe II. Only the EC-5 held a clean linear trend at high salinity. At or below EC 1:5 of 1.0 dS/m, all eight did reasonably well, and most could run on factory formulas.
For a buyer, that 1.0 dS/m line is the single most useful number in this piece. One caution: it came from prepared soils in China, not from a borehole-irrigated block here, so treat it as a threshold to test against, not a guarantee. It gives the grower a sharper question for a supplier than the word salinity: at what EC 1:5 does your factory curve stop holding? Expect confusion. The paper itself cites conflicting thresholds in the literature: some TDR methods suited only up to a bulk EC of 5 dS/m, others accurate only below 4, and one source claiming TDR readings were unaffected until soil solution EC passed 17.0. Those are three different ways to measure salt. Ask the supplier which one they mean. Our earlier post on why one EC reading under drip misses the salinity explains why a single sample from a wetted bulb will not settle the question either.
Moisture error becomes water-use error, and it grows
No one irrigates on a water content number by itself. A grower irrigates on a change in water content: how much the root zone has lost since the last reading, which is the crop's water use, and when that loss crosses a trigger. An error that looks small on the moisture scale does not stay small once you subtract one uncertain reading from another.
A field trial of nine sensors reported in the AGRIS record on uncertainty propagation measured exactly this. Nine probes, based on time-domain reflectometry, capacitance and electrical resistance, ran in silt loam and loamy sand in 2017 and 2018. The authors compared the crop evapotranspiration each sensor implied against the true value. In silt loam, every sensor underestimated crop water use, by between 14 and 31 percent. Loamy sand was worse and less consistent: deviations ran from 14 percent too high to 61 percent too low, depending on the sensor.
Read that against the Michigan figure. A sensor that sits within 0.04 m3/m3 on moisture can still be a third out on how much water the crop used. The moisture error is not constant through the wetting and drying cycle. It stretches and compresses the trace, and the trace is where the water-use figure comes from. Site-specific calibration repaired a lot of it. In silt loam, calibration improved total soil water by 45 percent and the water-use estimate by 17 percent. In loamy sand it improved total soil water by 42 percent, the irrigation trigger by 80 percent and the water-use estimate by 86 percent.
Two things carry to a Kenyan farm office. First, the authors' own conclusion: a sensor that ranks well on raw moisture accuracy can rank differently on the metric you actually use. Judge it on the decision, not the specification sheet. Second, the trigger gained most from calibration, and the trigger is what a grower actually acts on. Fast-draining sandy blocks here are the loamy-sand case in spirit. Those percentages were measured elsewhere and should not be quoted as Kenyan. The instability was measured in the kind of soil that drains fast, and that part transfers.
Two probes a metre apart: what we can honestly say
The brief for this piece was to show what NuaSense probes read when two sit a metre apart. Our record contains no such paired test, and this article will not pretend otherwise. The fleet does show a pooled spread. Across 10 NuaSense soil probes from 25 September to 25 October 2026, moisture averaged 73 percent of sensor scale. Most readings fell between 43 and 86 percent, the 10th to 90th percentiles. That pools both depths, and the probes sit on different farms.
That is a span of 43 points of scale, 86 minus 43. Part of it is real: soils, crops and irrigation differ. Part comes from a factory curve meeting different soils and returning different numbers for similar wetness. Pooled data cannot separate those causes. That is the point. A network average cannot tell a grower how far their own two probes should agree. Only a paired installation on their own block can. Our earlier post on the three numbers you need to read a soil moisture trace set out why percent of scale only gains meaning once you have found the wet and dry ends of your own soil.
Vertical or horizontal was never the problem
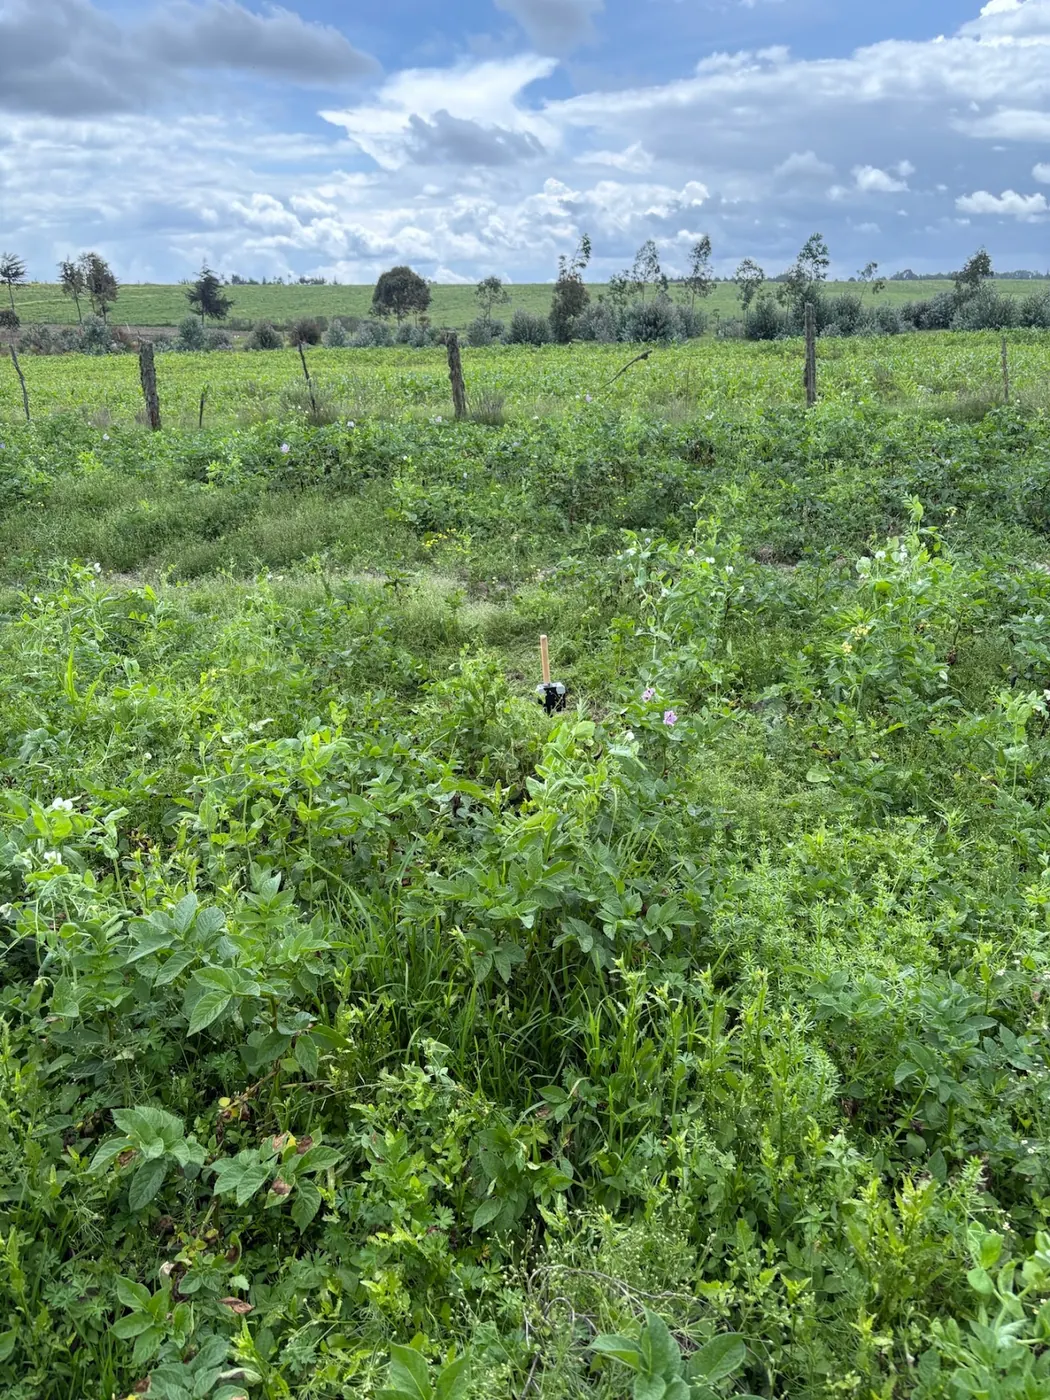
Orientation gets a lot of words in installation advice: vertical for an averaged reading, horizontal for a single depth. A nine-sensor field trial tested that directly across two soils and two seasons. It found orientation did not affect accuracy. That result deserves to travel. It frees a grower from one worry and moves attention to the ones that matter.
Arizona's guide lists them. In commercial fields it says sensor effectiveness is restrained by design limits, battery failure, probe corrosion, mineral build-up on the electrodes, damaged cables, sensor displacement and lost wireless connection. None of those concern the angle of the probe. They all concern the weeks after installation. Backfill settles. A tractor wheel catches a cable. A child pulls up the interesting stick in the vegetable row. Displacement is the nasty one. It turns a calibrated probe into an uncalibrated one without anyone noticing, because the number keeps arriving.
One more problem in that guide applies to most irrigated Kenyan horticulture: uneven wetting from drip or micro-sprinkler. A probe beside the emitter and one between two emitters read different soils at the same moment. Neither is wrong. Shallow sampling depth makes it worse, because a surface-only reading either catches the wetted bulb or misses it entirely. No published trial gives a Kenyan spacing figure for where to sit the probe relative to the emitter. After a normal irrigation, dig to the wetted edge with a trowel and place the probe with that in mind. That afternoon is worth more than any orientation argument.
Heat and time move the number too
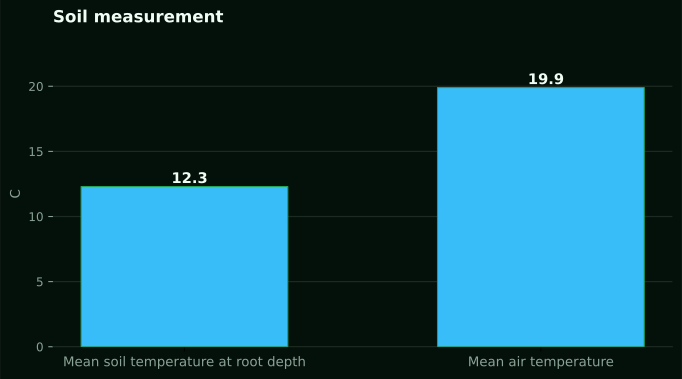
Two errors remain that have nothing to do with the soil at installation. Heat comes first. Arizona's guide reports that extreme heat speeds up sensor drift and probe wear. Its heat is not ours. Across 13 NuaSense weather stations from 25 September to 25 October 2026, air temperature ran between 0.0 and 36.7 °C, with a mean of 19.9 °C. A probe under black polythene in a lowland greenhouse lives well above that network mean. A grower in those conditions should assume the Arizona warning applies more, not less.
Drift comes second. The same guide states that sensors drift over time. It calls regular cleaning, battery replacement, recalibration and verification against manual measurements crucial. Drift is dangerous because it is slow. A probe that reads a little lower each month looks, on the phone, like a field slowly drying through the season. The grower chases it with water. Crop fine, pump bill not.
A check exists that costs nothing but time. Oregon's guide states that the feel and appearance method can estimate volumetric moisture within approximately 5 to 10 percent, depending on texture and operator skill. That is coarser than a good probe on a good day. But a hand does not drift and does not care about salt. A monthly handful from beside the probe, compared against the trace, catches drift before the season does. Oven drying is the gold standard. The Michigan paper calls it labour-intensive, slow, destructive and not real-time. For routine checking the hand is the instrument. The oven is for the one argument a year that needs settling.
Calibrating without a laboratory, and sometimes without a purchase
Site-specific calibration takes care of most of that error. But most Kenyan growers will never box up a sample and send it off for a dielectric curve. Arizona's guide offers something else, which it calls sensor standardization. Take a reading before an irrigation, another while it runs, and another after it stops. The moment water pools on the surface and then just drains away, that visibly saturated soil, is your near-saturation reference. The reading your soil sits at just before you would normally water is the threshold for that field. Two states, and that is all a scheduling decision needs. The probe is now calibrated to them, on the soil it is actually sitting in.
Call that relative calibration. It is exactly what an instrument reading percent of scale is made for. A NuaSense soil probe reports percent of sensor scale; it never claims a volumetric figure. The number is a position between two ends that the grower finds for himself. That is a weaker promise than a laboratory curve, and a more honest one. The laboratory curve, as the salinity trial showed, was drawn in sand or loam that is not yours.
So when is the cheaper option, or no purchase at all, the right call? On a small, uniform block that is watered by hand and walked every day, the feel method at 5 to 10 percent is a serious competitor to any probe, and it costs nothing. Where saline water makes an EC 1:5 above 1.0 dS/m plausible, buying a probe before you check the water buys you a number that leans wet. A continuous probe earns its place where the decision gets made while nobody is standing in the field: an overnight drip cycle, a greenhouse at the weekend, a block two hours from the office. For the wider map, NuaSense's overview of smart irrigation in Kenya surveys drip kits, solar pumping and sensor platforms. This article is only about how far the probe on that map can be trusted.
The decisions that survive a wrong number
Timing decisions survive. Did the overnight irrigation reach the deeper probe, or did it stop in the top layer? A probe that is a tenth out on absolute content still shows a rise, and still shows when it arrived. Direction survives too. A root zone drying faster this week than last will show on a biased curve, because the bias is roughly the same both weeks. A stuck valve, a burst lateral, a pump that never started: each is a shape in the trace. Shapes hold up even when the offset is off.
Quantity decisions do not survive a factory curve. How many millimetres should go on? How much did the crop use this week? Is the deficit a fifth or a third of available water? The nine-sensor trial puts water-use error at up to a third in a forgiving soil and up to 61 percent in a sandy one. No Kenyan trial narrows that. A grower who needs quantities needs a site calibration or a water meter on the line, and should say so before buying.
On price, the only figures this site publishes are its own: a soil sensor at KES 7,000 excluding taxes, the two-moisture, two-temperature variant at KES 9,000, the EC version at KES 10,000, and the weather station that carries the probes online at KES 30,000. For timing and direction, the plain probe is the right one. The EC variant pays for a channel not yet streaming from the deployed fleet. For saline water and quantity decisions, a probe alone is the wrong purchase, whatever the brand. Our soil moisture sensor page describes what the two depths report. The reading will still be a model's output, and the grower who treats it that way makes better calls than the one who treats it as fact.