An EC meter dropped into wet soil gives a reading in seconds. What that reading means for your block, and whether it should change how much water you push through the drip lines this week, depends on a chain of conversions that most growers never see. Soil EC salinity is not a single measurement, it is a proxy, and every point in the chain from probe to decision can go wrong on its own. This piece takes that chain apart, step by step, with the number that governs each link, and ends with the ways the chain actually breaks in a working fertigation programme.
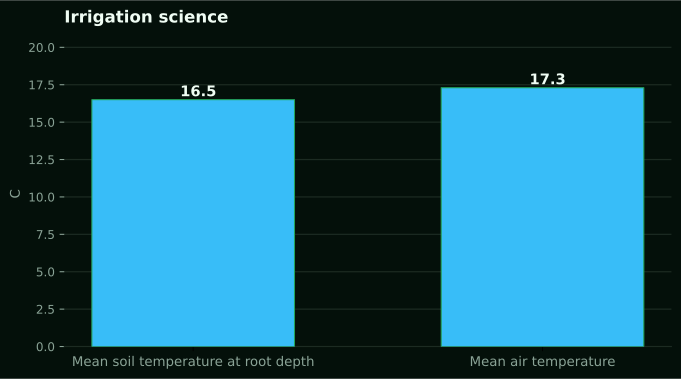
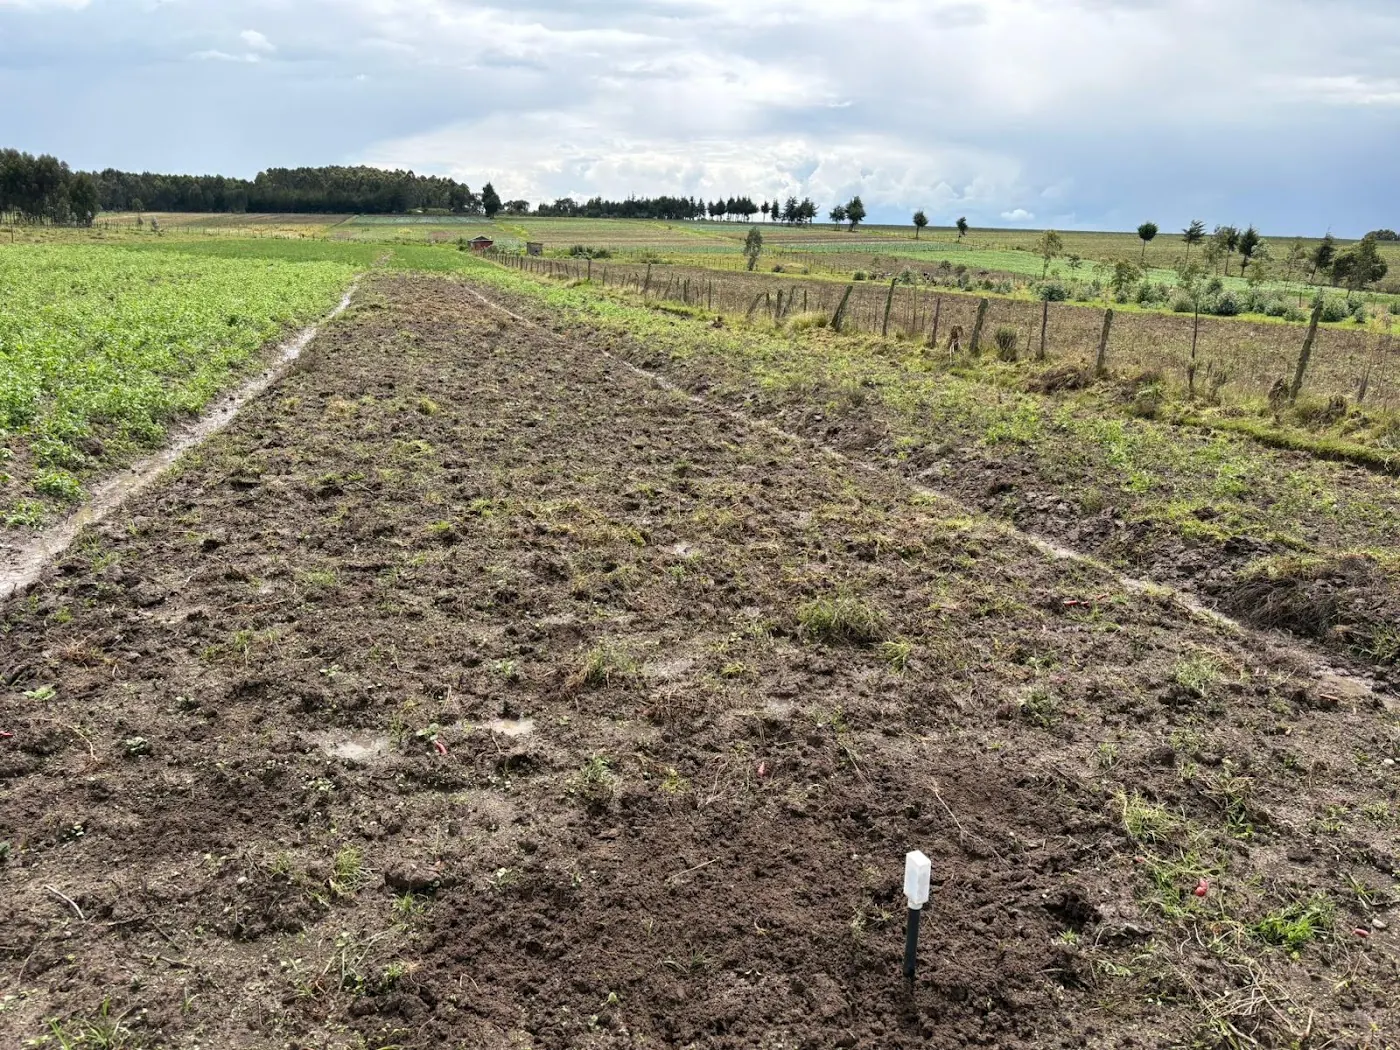
Measured by NuaSense weather stations and soil probes on Kenyan farms, over the period stated with each figure. Past readings, not a forecast.
The current has to pass through something
An EC probe pushes a small current between two electrodes and reads how easily it moves. Dissolved salts carry that current. More salt, less resistance, higher reading. The unit is deciSiemens per metre (dS/m), always referenced to 25 degrees Celsius, because conductivity rises with temperature and a raw reading from a hot afternoon will read high for reasons that have nothing to do with salt. This is the baseline definition used across the salinity literature, including the MENA salinity review published in Environmental Science and Pollution Research, and it is worth holding onto before anything else: the number on the screen is not a nutrient reading. It is a bulk measure of everything ionic in the water film touching the electrodes, sodium and chloride most of all, because those ions move fastest and dominate the current.
The temperature correction matters more on a Kenyan block than the source literature usually implies, because most of that literature was written for temperate irrigation schemes where soil temperature swings less across a day. A probe read at midday in an unshaded Rift Valley greenhouse and again at dawn will disagree even if nothing about the salt content has changed, purely because the correction to 25 degrees is doing more work at the extremes. If you are comparing readings across a week to decide whether salt is genuinely rising, take them at the same time of day, or accept that the temperature swing is part of your noise floor.
Sodium and chloride do most of the conducting
Not every ion contributes equally. Sodium and chloride are small and mobile, so they carry a disproportionate share of the current relative to their concentration. Calcium and magnesium, present in most Kenyan soils in reasonable amounts, conduct less per unit concentration. This matters because two soils with the same total salt weight can give different EC readings depending on which salts dominate, and it is part of why EC cannot tell you which fertiliser ion is present, only that something dissolved is there. A soil rich in gypsum will not read the same as one rich in sodium chloride at equal salt mass, and no meter distinguishes the two without a lab test behind it.
This is where a fertigation programme can mislead a grower reading EC casually. Push a heavy dose of a highly soluble fertiliser salt through the drip line and the meter will jump, exactly as it would if a borehole had gone brackish. The instrument gives you no way to separate a nutrient spike you engineered on purpose from a salt problem building up behind it. The only way to tell the two apart is to know your fertigation schedule and read the EC trend against it, watching for a rise that persists after the feed has been flushed rather than one that tracks the injection pump.
Water leaves, salt stays
The mechanism that actually builds up salinity in an irrigated block is simple and worth stating plainly. Irrigation water carries a small dissolved salt load. The crop and the sun remove water through evapotranspiration. The salt does not evaporate, it stays behind and concentrates in the remaining soil water. Apply water, lose water to the crop, repeat for a season, and the salt left in the root zone climbs every cycle unless something moves it back out. This is the process described in the New Mexico State University leaching requirement guidance for pecan and fruit trees, and it holds for any irrigated system, drip or furrow, anywhere the water applied contains dissolved solids at all.
There is a quiet corollary here that many growers miss: rainfall does the leaching work for free, and irrigation almost never does, because a drip or furrow system is designed to apply exactly what the crop needs, not a surplus. A rain-fed block gets an occasional flush from a storm large enough to push water past the root zone. A block that is entirely irrigated, especially under drip where every drop is metered, has to have that flush engineered in on purpose, or the salt simply has nowhere to go. This is the practical reason the leaching fraction exists as a deliberate line item rather than an accident of weather.
The saturation extract sets the reference point
The number growers actually want to compare against crop tolerance tables is ECe, the electrical conductivity of a saturated soil paste extract, the standard defined in the FAO standard operating procedure for soil electrical conductivity. A soil is classed as saline once ECe passes 4 dS/m. Below 2 to 4 dS/m most saline-sensitive crops show no yield penalty; above 8 dS/m most crops show salt stress injury, according to the same MENA review cited above. But ECe is slow to produce. It requires saturating a soil sample to a specific paste consistency, extracting the liquid, and running it through lab equipment, a process the Frontiers in Soil Science modelling study of rice irrigation schemes describes as demanding and skill-dependent. That is why almost nobody in the field measures ECe directly.
It is also worth being honest about what the paste extract itself represents. The concentration of salts in that saturation extract runs at roughly half the concentration found in the actual soil solution at field capacity, according to the same Frontiers study, because the paste method deliberately dilutes the sample to a standard, reproducible wetness. A crop's roots are not sitting in the paste extract concentration, they are sitting in something closer to double it once the soil has drained to field capacity. Tolerance tables built on ECe already account for this in their thresholds, but it is a reminder that the paste number is a calibrated proxy for lab comparability, not a description of what the root actually experiences at any given moment.
Diluted extracts stand in for the real thing
What labs and field kits actually run is a diluted extract, soil mixed with water at a fixed ratio such as 1:1, 1:2.5 or 1:5, then read for EC. The Frontiers study, working from 706 soil samples across three rice irrigation schemes, found a strong linear relationship between EC at a 1:2.5 dilution and true ECe, with an R squared above 0.95, a root mean square error of 1.4, and a mean absolute error of 0.85. That is a good fit, but it is a fit measured on rice paddy soils in the schemes that study sampled, not on a Kenyan greenhouse block or an open field under drip. The conversion factor between a diluted reading and ECe shifts with soil texture, and the same study notes that sandy soils drain and leach more freely than clay soils, which accumulate salts more easily at the same irrigation history.
An error band of that size is not trivial once you are close to a threshold. If a diluted reading converts to an ECe estimate of 3.5 dS/m and the mean absolute error from the rice paddy study is 0.85, the true value could plausibly sit anywhere between roughly 2.6 and 4.4, which is the difference between a soil that is still safe for a saline-sensitive crop and one that has just crossed into the range where yield loss starts. Treat any 1:2.5 conversion as a starting estimate, not a fixed multiplier, until you have checked it against a paste extract from your own soil at least once, and treat readings that sit near a threshold with more suspicion than readings that sit clearly on one side of it.
Saline and sodic are not the same failure
A saline soil has too much dissolved salt in the root zone, defined by ECe above 4 dS/m under the FAO procedure. A sodic soil has a structural problem: too much sodium sitting on the soil's exchange sites relative to calcium and magnesium, measured as exchangeable sodium percentage above 15, or as a sodium adsorption ratio above 13 under the University of Georgia Extension guidance on soil salinity testing. Sodic soil paste can run a pH of 8.2 or higher, occasionally past 10.5. The two conditions often travel together but the fix is different.
A saline soil responds to leaching with water of reasonable quality: push enough water through and the salt goes with it. A sodic soil needs the sodium displaced off the exchange sites first, usually with gypsum or a calcium source, before leaching water can do anything useful, because sodium left on clay particles collapses soil structure and shuts down the very drainage a leaching fraction depends on. This is the trap that catches growers who read a high EC number, assume it means saline, and simply add more water. If the underlying problem is structural, the extra water sits on the surface, drains poorly, and the leaching fraction calculation built for a saline soil never gets the chance to work as designed.
The leaching fraction is the water you add on purpose
The leaching requirement is the extra irrigation water applied specifically to push accumulated salt below the root zone, expressed as a fraction of the total water applied. The NMSU guidance gives the working method: take the electrical conductivity of your irrigation water (ECiw) and the electrical conductivity you are willing to tolerate in the root zone (ECe for the crop), and use those to size the leaching fraction, since the electrical conductivity of the drainage water itself is rarely measured directly. In the NMSU worked example, irrigation water at 1,700 micromhos (roughly 1.7 dS/m) applied to pecan trees required a leaching fraction of 0.2, meaning 20 percent more water than the crop's evapotranspiration demand, applied specifically to carry salt past the root zone rather than to feed the tree.
What the worked example does not spell out, but is implicit in the arithmetic, is that the leaching fraction is not a one-time correction. It is a standing percentage added to every irrigation cycle for as long as the water source stays at that salinity, because salt keeps arriving with every application and keeps needing to be pushed out again. A grower who applies the extra 20 percent once, after a bad EC reading, and then reverts to the normal schedule has not solved anything. The next season of irrigation from the same brackish source starts the accumulation over from wherever it left off.
Walking the pecan number onto a Kenyan block
That 0.2 figure was measured for pecan trees against a specific irrigation water quality in the United States. It is not a number you can borrow for tomatoes under drip in a Kenyan greenhouse, because the leaching fraction moves with both the crop's own salt tolerance and the salinity of the water source, and neither of those transfers automatically. What does transfer is the logic: measure your irrigation water's EC, decide what ECe your crop can tolerate using the 2 to 4 dS/m sensitivity threshold as a guide, and size the extra water accordingly rather than guessing at a round percentage.
A borehole running brackish in a coastal or Rift Valley block will demand a larger leaching fraction than a rain-fed dam feeding the same greenhouse, and no single number covers both. This same principle, that a borrowed coefficient only travels as far as the conditions it was measured under, is the argument our earlier piece on turning evapotranspiration into an irrigation depth makes about crop coefficients: the table gets you started, the block gets you the real number. There is no published Kenyan leaching fraction table that covers common crops against common water sources, and building one properly would require exactly the kind of paired ECiw and ECe measurement most farms have never done. Until that table exists, the honest answer is to measure your own water and derive your own fraction using the NMSU method rather than lifting a figure from a crop you are not growing under a water quality you have not tested.
What a field EC meter can and cannot save you from
Field EC meters and colour-coded kits exist precisely because lab ECe is slow. The CGIAR comparison of soil salinity measurement techniques confirms that EC measurement gives a quick, inexpensive alternative to laboratory analysis, and the AICCRA report on smallholder irrigation technology in eastern and central Africa documents a package of low-cost tools, including a wetting front detector, nitrate test strips, and an EC meter, being distributed to smallholders in Uganda's Kasese district. Growers there using the wider VIA toolkit reported sharply higher incomes from vegetable and grain plots.
The EC meter in that kit does one job well: it flags rising overall salt load quickly enough to act on. It does not tell you which ion is driving the reading, and it does not replace an occasional paste extract check, particularly once a reading starts climbing and you need to know whether you are dealing with a saline problem, a sodic one, or both. The Uganda result is worth reading for what it actually demonstrates, which is that a cheap field instrument used regularly beats an accurate lab instrument used rarely, not that the field meter is somehow measuring something more precise than a paste extract. It is measuring the same physics, just with more noise and far more frequency, and frequency is what a salt build up problem actually needs.
Sampling badly wastes a good meter
A meter reading is only as good as the soil it touches. The Georgia Extension protocol calls for eight to ten cores from a uniform area, mixed into a single composite sample, roughly a pound in weight, before any extract is made. A single spot check next to a drip emitter, where salts have been actively pushed to the wetting front edge, will read differently from a spot mid-bed, and neither represents the block on its own.
This is the same argument our earlier piece on soil moisture readings makes about a single point never standing in for a field: one EC reading from one point tells you about that point, not your block, and a decision to add a leaching pass on the strength of one probe stuck near an emitter line is a decision built on a biased sample. Under drip irrigation specifically, salt tends to concentrate at the wetting front edge, the boundary where water stops moving and evaporates or is taken up, rather than directly under the emitter where water is freshest. A composite sample that mixes cores from near the emitter and cores from the wetting front edge will average out a real spatial pattern into a number that describes neither location well. Knowing where your own emitter geometry pushes salt matters more than knowing the textbook average.
Where this breaks under real fertigation
The failures worth naming are specific. First, applying a leaching fraction calculated from a fresh, low-EC water source and then switching boreholes mid-season without recalculating: the fraction was sized for the old water, not the new, and a borehole that runs sweeter or more brackish through the dry season changes the arithmetic without anyone noticing until the crop shows stress.
Second, treating a rising EC trend as automatically a fertigation problem when it may be a sodic structure problem instead, where more water alone will not fix drainage that has already collapsed. Third, using a diluted extract conversion factor lifted from a rice paddy study on a sandy greenhouse soil that drains nothing like a paddy does, and trusting the converted ECe number more than the error band actually allows. Fourth, and most common, checking EC once after a salt scare and not again: salt does not accumulate in a straight line, it tracks irrigation water quality and evapotranspiration demand together, both of which shift through a season. A single reassuring reading in a wet month tells you nothing about what the same block looks like three dry months later, once evapotranspiration has pulled far more water out of the root zone than it has put back.
NuaSense's EC product is built for exactly this kind of recurring check rather than a one-off reading, though it is not yet streaming from our deployed soil fleet, and our own soil temperature sensors on the same probes will tell you when evapotranspiration demand is rising fast enough that salt concentration is likely following it up. The number itself never argues with you. It just sits there until someone bothers to read it against the right baseline, twice, and against the right depth, in the right season, from a sample that actually represents the ground the crop is rooted in.
NuaSense has a longer piece on this: Declining soil health in Kenya, reasons why and how to counteract looks at nutrient depletion and structural decline from continuous cultivation, which sits alongside salinity as one of the slower failures a farm manager can miss between seasons.