You set your drip run time from a manual, a supplier's rule of thumb, or whatever the previous farm manager wrote in the logbook. None of those numbers came from your soil. Soil infiltration rate, how fast water actually enters the surface and moves down, is the number that should set run time, and it is almost never measured on Kenyan commercial blocks. It is treated as a constant when it is one of the most variable things on a farm.
This matters more than most irrigation variables because it is invisible in the way soil moisture readings are not. A soil moisture sensor will tell you the block is dry. It will not tell you whether the water you just applied actually infiltrated or ran off the surface and pooled in the furrow. Two blocks with identical texture on a soil map can behave completely differently once water hits them, and the map will never show you that.
The decision you are actually making
There isn't one correct infiltration rate to chase. There is a decision: how much time and money do you spend finding out what your own block does, versus accepting the error that comes from using a generic figure. That error is not small. FAO treats infiltration rates below 3 mm/hour as low and above 12 mm/hour as relatively high, a fourfold spread that alone should tell you a single number cannot cover a whole farm, let alone a whole crop guide.
The options in front of a Kenyan farm manager are not equally priced or equally accurate, and that is the comparison worth making before you touch a run-time setting on the controller. Some methods take fifteen minutes and a tin can. Others take most of a day and a water bowser. The expensive ones are not always the right ones for your situation, and the cheap ones are not always wrong.
Option one: keep using the textbook number
The textbook approach uses a generic figure by soil texture class: clay soils around 0.10 to 0.25 inch per hour, loam 0.25 to 0.50, sandy soils 0.50 to 0.75 inch per hour, according to extension guidance from Nebraska. Converted, that is roughly 2.5 to 6.4 mm/hour for clay and up to about 19 mm/hour for sandy soil. Convenient. Free. And built on a texture class, not your block.
The problem is that texture alone does not determine infiltration. A study in Laikipia County found infiltration rates of 73.3 mm/hour under tree cover at one ranch and only 25 mm/hour under grass at the same ranch, a threefold difference from vegetation alone within a few hundred metres. At a second ranch nearby, bare ground actually infiltrated faster than tree-covered ground, 37.8 mm/hour against 5.7 mm/hour. Two ranches, same rough geography, opposite pattern. A textbook figure by soil class would have missed both, and would have missed them in opposite directions.
Option two: a cheap on-farm test
The coffee-can test costs almost nothing. University of Nebraska Extension's guidance instructs readers to cut the top and bottom out of a can, push it into the soil, fill it with water, and time how long the water takes to drop a measured distance. It is crude. It disturbs the soil surface on insertion, it is sensitive to how level you set the can, and one reading tells you about one spot, not a block.
But crude and free beats absent. For a smallholder or a mid-size commercial block without a testing budget, doing this test in three or four spots representing different microsites, near a tree line, in open ground, on a slope, gives you a rough spread rather than a single confident wrong number. Oregon State University Extension's infiltration testing fact sheet advises running the test after the ground has had at least a day to settle: infiltration tests should never be conducted during rain, within roughly a day of a significant storm, or on frozen ground, which is less of an issue in most of Kenya but the settling principle after heavy rain still applies.
Option three: the double-ring infiltrometer
This is the standard instrument test, two concentric rings driven into the soil, water maintained in both, the inner ring's drop measured to control for lateral spread. It is more repeatable than the coffee can and it is what most agronomy references default to. Oregon State University Extension's infiltration testing fact sheet notes a known bias, citing the Washington State Department of Ecology's statement that both the double-ring infiltrometer test and the percolation test overestimate infiltration rates.
That bias matters for a run-time decision. If your test method systematically reads high, and you set irrigation duration off that reading, you will under-water believing the soil is taking more than it is. On a flower farm running fixed-duration drip cycles across many blocks, that error compounds across a season. The same Washington guidance recommends the Pilot Infiltration Test as the most accurate estimate available, but flags that it can take up to 17 hours and needs a large volume of water, which puts it out of reach for routine use on most Kenyan farms without dedicated capital equipment.
There is a middle path worth naming explicitly, because the guidance does not force a binary choice between crude and slow. Use the coffee-can survey to map where the block is inconsistent, then bring the double-ring test to only those two or three flagged spots, treating its reading as a ceiling rather than a working figure. That approach costs a fraction of testing the whole block with the ring, while still giving you a defensible number for the zones that matter most, which is usually the ones nearest the pump or the ones where crop stress keeps showing up despite apparently adequate run time.
What the water itself is doing to your infiltration rate
Nobody checks water quality when infiltration runs slow, but FAO is specific that infiltration rate increases with salinity and decreases with lower salinity or higher sodium adsorption ratio. Counterintuitively, very low salinity water, under about 0.2 dS/m, almost always causes infiltration problems regardless of the sodium ratio. Low salinity water is corrosive to the soil surface: it leaches calcium and causes the surface to disperse and seal.
Rainfall is very low salinity water by nature, and FAO notes that irrigated areas frequently see exceptionally low infiltration of rainfall specifically, causing runoff that a grower might blame on soil texture when the actual cause is chemistry at the surface. If your borehole water reads clean and low in dissolved salts, that is not automatically good news for infiltration. It is worth checking sodium relative to calcium too: FAO states that sodium in excess of about three times calcium often causes severe infiltration problems through dispersion and pore plugging. None of this shows up on a soil texture map, and none of it shows up on a moisture sensor reading either, which is one reason a soil moisture reading means nothing until you know three other numbers.
Vegetation and management change the number more than texture does
A meta-analysis of 89 field trials found that introducing perennials, grasses, agroforestry or managed forestry, raised infiltration by a mean of 59.2 percent compared to conventional management, and cover crops raised it by 34.8 percent. No-till showed no significant overall effect, 5.7 percent with wide error margins, though it helped more in wetter climates combined with residue retention. Crop rotation alone was also non-significant. Livestock grazing on cropland cut infiltration by 21.3 percent.
The spread of confidence across these practices is itself the useful part. Perennials and cover crops show a mean effect large enough to plan around. No-till and rotation do not, which means a farm manager who adopted no-till expecting an infiltration dividend on the strength of a single glossy claim was working from an average that the underlying trials did not actually support once climate and residue handling were accounted for. Grazing is the one negative and consistent effect in the set, and it is the easiest for a mixed livestock and crop operation to control directly: keep animals off cropland when it is wet, and off it altogether where infiltration is already marginal.
A Western Kenya trial on soil conservation species reported by ILRI found Calliandra treatments had the lowest runoff and lowest soil erosion across seasons, with infiltration highest under Calliandra of the treatments tested, and earthworm counts markedly higher under Mucuna and Calliandra than other crop covers, 229 and 165 worms per square metre respectively. Earthworm activity builds the connected pore channels that let water move down rather than pond. If your block has bare inter-rows, this is a lever that costs a hedge line, not a sensor budget.
Salt-affected soils and clay content: two factors nobody tests for locally
A study on Kenyan salt-affected soils held in the University of Nairobi repository found infiltration highly sensitive even to low levels of exchangeable sodium percentage, meaning a soil that looks fine on a texture chart can behave badly once sodium starts occupying exchange sites. Separately, soils with 10 to 30 percent clay content were found most susceptible to surface seal formation and had the lowest infiltration rates, a narrower band than most growers would assume dominated by heavy clay soils alone.
This is why a modelled soil baseline, the kind pulled from a national soil map at roughly 30 metre resolution, is a starting point and not a verdict. It can tell you the general clay fraction for your area. It cannot tell you whether your specific field sits in that 10 to 30 percent seal-prone band, and it was never built to answer that question.
Where infiltration sits on the landscape, not just in the soil
Position on a slope changes infiltration independently of soil type. In a study of two Laikipia ranches, headwater zones consistently had the highest infiltration rates, while hillslope and riparian zones dropped to zero mm/hour. A separate catchment study in Zanjan indexed by AGRIS found pasture land had infiltration rates roughly 86 and 66 times lower than rainfed and irrigated land respectively within the same catchment.
Neither of those studies was run on a Kenyan commercial farm, and the multiples will not transfer directly to your block. What transfers is the principle: topographic position within a single farm can swing infiltration by an order of magnitude, which means a single test pit near the pump house tells you almost nothing about the block furthest from it. If your farm has any slope at all, test at the top, middle and bottom separately before setting one run time for the whole field.
Turning a measured rate into an actual run time
Once you have a rate, the arithmetic is simple and worth showing. Nebraska extension's guidance gives the example that a system applying 3/8 inch in 15 minutes needs 40 minutes to apply a full inch. The same logic applies to any infiltration figure: if your measured rate is the limiting factor, run time should be set so application rate does not exceed it, otherwise the excess runs off rather than soaking in, regardless of how thirsty the crop is.
The practical trap is applying this arithmetic once and treating it as fixed for the season. Infiltration rate is not a fixed property of a field the way slope is. A block that carried a decent rate in June, before the short rains compacted the surface and knocked back the cover crop between rows, will carry a lower rate in August whether or not anyone measured it again. Re-testing after a heavy rain event, after a tillage pass, or after a change in what is growing between the rows is not excessive caution, it is the same discipline as re-checking a pump's output after a service.
Root depth also sets how much water you are trying to place, separate from the rate question. Guidance for landscape watering suggests wetting the upper 5 to 6 inches for turf and vegetables, 8 to 10 inches for herbaceous perennials, and 12 to 18 inches for woody trees and shrubs. Commercial crop rooting depths differ from these landscape figures, but the principle, matching target wetting depth to root zone rather than applying a fixed volume regardless of crop, holds. Pair a measured infiltration rate with ET0 turned into a daily irrigation depth and you get a run time built from your block's actual behaviour rather than a supplier default.
What sensors do and do not solve here
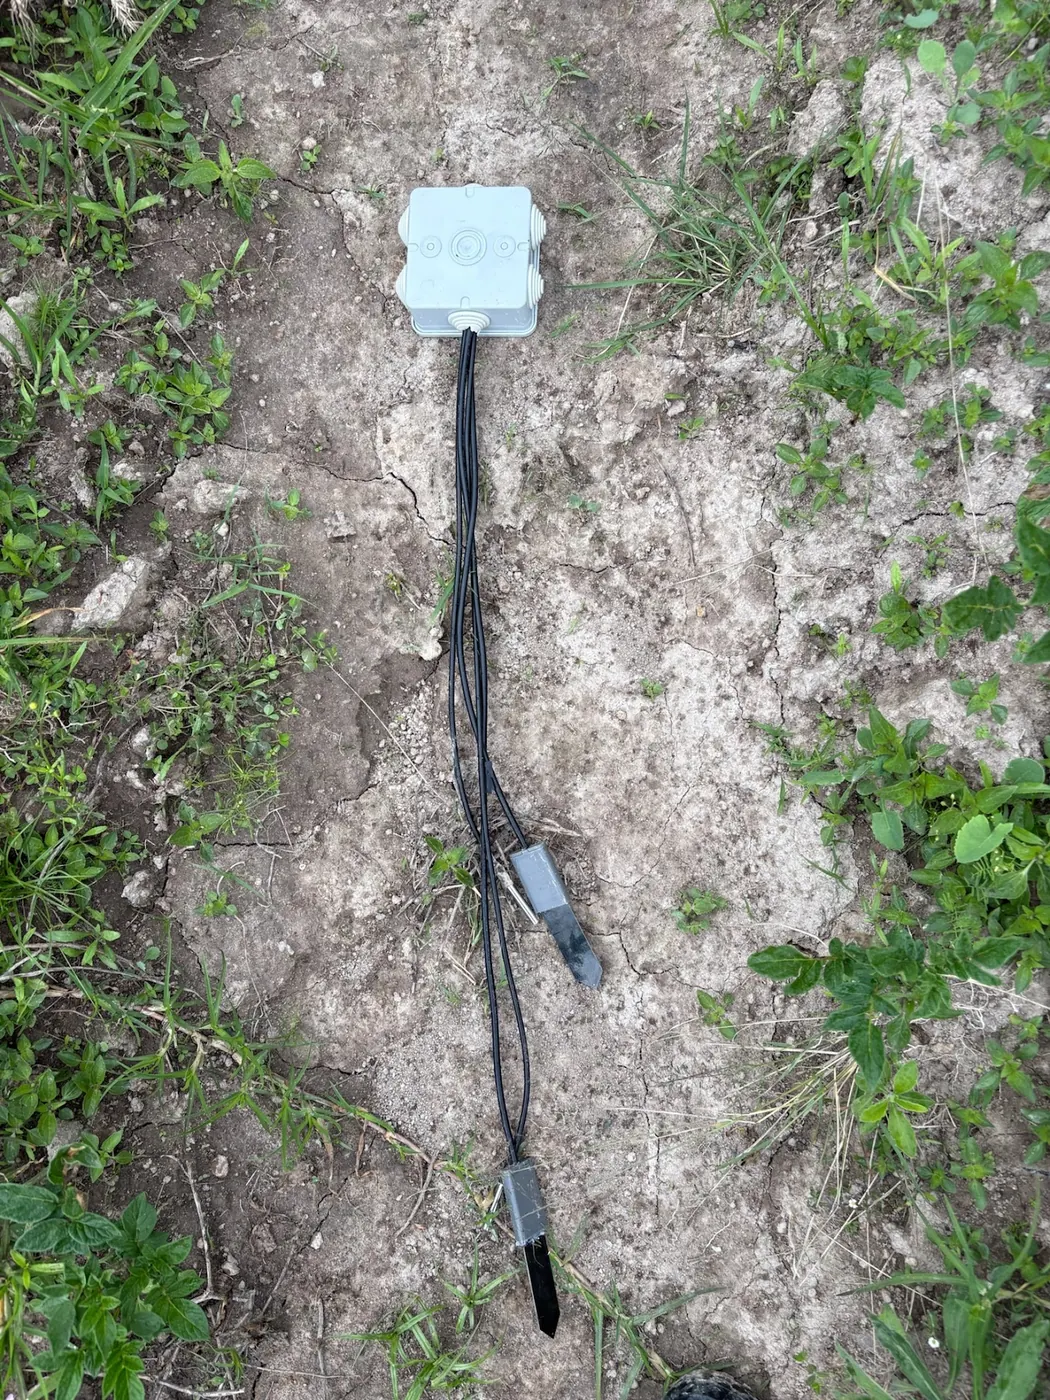
Soil moisture sensors and soil temperature sensors tell you the outcome of an irrigation event, not the mechanism. A shallow probe reading that rises fast after irrigation, while the deeper probe barely moves, is a strong hint that water is either running off before it soaks in or perching above a compacted layer, which is exactly the kind of infiltration problem this article has been describing. It is a diagnostic signal, not a measurement of infiltration rate itself, and it will not replace an actual field test.
NuaSense's overview of smart irrigation in Kenya covers how drip and micro-irrigation systems pair with soil moisture monitoring on smallholder and commercial farms, which is useful background if you are deciding how much sensor infrastructure to add once your run times are actually correct. Fixing run time with a bad infiltration assumption baked in just moves the error to a more expensive part of the farm.
Testing frequency and what the guidance actually recommends
Stormwater design guidance from Oregon recommends one infiltration test per 10,000 square feet within larger project areas. That figure comes from stormwater engineering, not agriculture, and a Kenyan flower farm or vegetable block is not going to test every 930 square metres. But the underlying idea, that infiltration needs testing at a density related to how much internal variation the site has rather than once per farm, is the transferable part. A flat, uniform block might justify three or four test points. A block that crosses a slope, a soil transition, or a boundary between an old grazing paddock and cultivated ground needs more.
There is no published Kenyan table telling growers how many tests per hectare to run on a coffee block versus a flower block versus an irrigated vegetable plot. That gap is real, and pretending otherwise with an invented number would be worse than admitting it. The honest answer is to start with the coffee-can method at every visible change in vegetation, slope or soil colour on the block, and treat the double-ring test as a follow-up check on whichever spots the cheap test flags as inconsistent.
The position worth taking
If you manage more than a few hectares and you have never measured infiltration on the block, your run time is a guess dressed up as a schedule. The evidence above, mostly measured outside Kenya but including Kenyan work from Laikipia and Western Kenya, shows spreads of three to four times within a single farm from vegetation and slope alone, before water chemistry or clay seal formation are even considered. A generic texture-based figure cannot carry that much variation.
Start cheap. The coffee-can test at several points across the block, done outside a rain window, will tell you more in an afternoon than a soil map will ever tell you about your own field. Save the double-ring or pilot infiltration test for the spots that need arbitration, and remember the double-ring reading runs high, so treat it as an upper bound rather than a working number. Run time follows from there, not the other way round.
FAQ
Also drawn on for this piece: Soil Infiltration.