Choose the spot from where the water lands
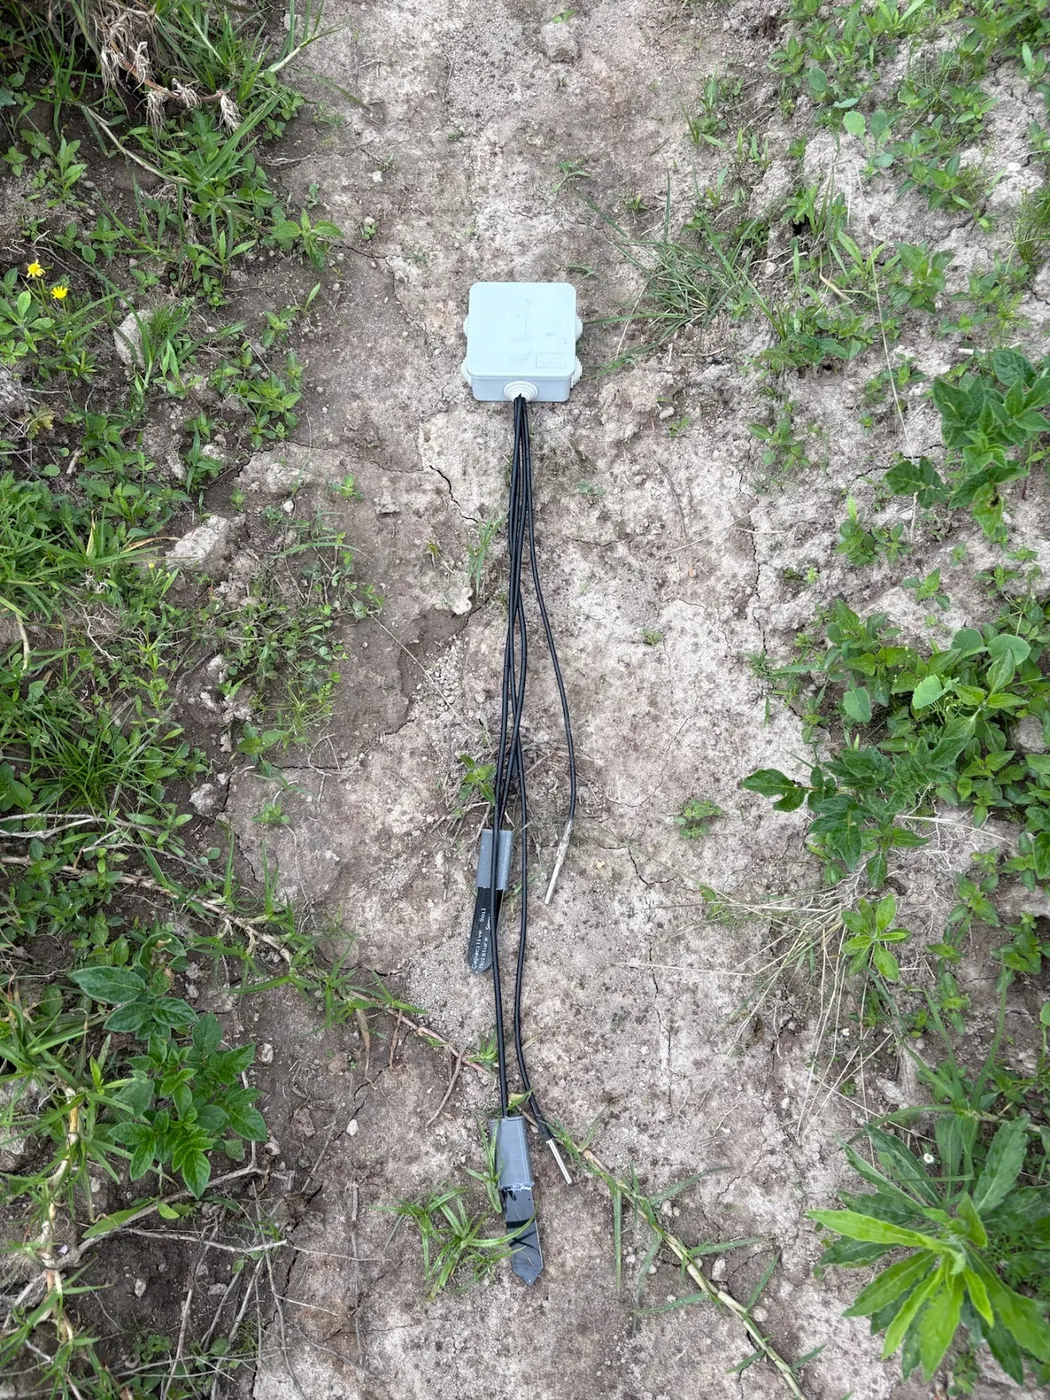
Start the soil moisture sensor installation where the water lands, because a probe reports the soil touching it and nothing else. The Arizona extension guide to maintaining field-installed sensors is blunt about why: uneven wetting from drip and micro-sprinkler systems, together with shallow sensor sampling depths, complicates what the data can say, and it recommends multiple sensors at various depths and locations, guided by local soil and irrigation knowledge. That guide was written for growers with large drip blocks and pivots. The Kenyan block is usually smaller and the irrigation sparser. AICCRA's regional reporting on tech-backed irrigation puts irrigated land in sub-Saharan Africa at less than five percent of cultivated area, against a global average of thirty percent, so the probe you are placing is more likely to sit on a small irrigated plot or on rain-fed ground than on a scheme with uniform wetting.
That changes where you put the probe in two ways. With drip, put it inside the wetted zone of one emitter, not between two. Find the wetted edge by digging after a run; don't read it off a chart. The Arizona guidance gives no spacing figure for your line, and neither does any other source here. With sprinkler or furrow, pick a spot the water reaches every run, not the tail end that only wets when pressure holds. On a rain-fed plot, the probe should represent the whole block. That rules out the low corner that stays wet and the path that compacts. One probe speaks for one spot. If the budget stretches to a second, spend the Arizona advice on varying location across the block rather than doubling up at the same point.
Pick the depth from the roots, in one-foot steps
Roots decide the depth. The only depth rule in this source list is a rough one. Oregon State's bulletin on soil moisture monitoring for irrigation scheduling describes the feel and appearance method as checking soil in one-foot steps down to the effective rooting depth. It also gives the arithmetic that shows why depth matters: a volumetric water content of 0.25 cm³ per cm³ in a 12-inch root zone equals 3 inches of stored water, since 0.25 times 12 is 3. A probe above the roots measures water the crop has already used. One below them measures water the crop cannot reach. Neither tells you when to open the valve.
NuaSense soil sensors read at two depths, one shallow probe and one deeper, and each has a moisture channel and a soil temperature channel. No centimetre figure is published for either depth, and that is on purpose. Burial depth is set at each installation by crop and rooting pattern; a number printed as a specification would be wrong on most blocks. What the two-depth design does show is how different those layers can be. Across 15 NuaSense soil probes in Kenya between 02 October and 01 November 2026, soil temperature averaged 14.3 °C. But the steadier depth moved through 2.6 °C over the period, while the more variable depth moved through 12.2 °C. Treat the steadier span as one and that is a factor of 4.7. Two layers that far apart are not one soil, and a single probe samples only one of them. The soil temperature sensor page explains what that channel is for. For installation, the point is this: the shallow probe goes where the fine roots feed, the deeper one where the crop draws between irrigations, and you settle both with a spade, not a table.
Vertical or horizontal: stop arguing
Every installation argument seems to end up on orientation, and the best field trial in this list says that argument is a waste of time. A nine-sensor comparison published through AGRIS tested probes using time-domain reflectometry, capacitance and electrical resistance in silt loam and loamy sand over the 2017 and 2018 growing seasons. It found installation orientation, vertical or horizontal, did not affect accuracy. Accuracy depended on three other things: sensor type, soil type and calibration type. That carries over. A Kenyan soil gives a probe no reason to care which way its electrodes point.
Orientation does change which slice of soil the probe averages. Lay a probe flat and it samples one depth band. Push it in vertically and it averages across its length. Choose by the question you need answered, then stop. The hours a grower might spend fussing over angle are better spent on the soil-type and calibration factors that did move accuracy. The sections below take those in turn. One practical note follows from the trial even though it does not give it: however the probe lies, the cable should leave the hole without pulling on the probe when the trench is closed. The Arizona guide lists sensor displacement among the common field faults.
Dig the hole, and admit what no source says about the backfill
To be straight about it, none of the eleven sources behind this piece gives a backfill procedure or a settling time that survived checking. There is no tamping sequence, no slurry recipe, no watering-in step, and no number of hours or days to wait before the first reading counts. Vendor pages offer all of these, usually with confident figures. That is exactly why they were left out.
What is physically at stake is simple enough. A capacitance probe reports the dielectric of whatever touches its electrodes. Wet soil bends the field strongly; air barely bends it at all. A pocket of air against the probe therefore reads as dry soil, and it keeps reading that way after the soil around it has wetted. Water moves through the soil matrix, not across a void. The post on probe readings that look wrong already went through what an air gap, a root and a slow drift each do to the trace. It also admitted that the air-gap reasoning had no field source behind it. That is still true.
What you can judge the hole on is the material. The soil that goes back around the probe should be the soil that came out of it, in the layer it came from. A probe buried in subsoil from the bottom of the hole is anchored against the wrong material. A stone pressed against the electrodes is a void with a solid in it. Beyond that the bank says nothing. Whether the contact is good is not a feel in the hand; it is the first irrigation cycles that tell you, and the before, during and after check below is built to read them.
Know the texture before you trust the factory curve
The texture question has to be settled before the first reading means anything, because the number a probe gives you is the output of a curve drawn on somebody else's soil. The Arizona guide states that standard factory calibrations often fail in the sandy, clay and calcareous soils common across Arizona, and that texture, salinity and temperature all significantly influence readings; on that basis it recommends site-specific calibration for texture, bulk density and salinity. The AGRIS nine-sensor trial measured what that failure costs. In silt loam all nine sensors underestimated crop evapotranspiration, by between 14 and 31 percent. In loamy sand the same sensors scattered from 14 percent over to 61 percent under. Same hardware, different texture, opposite sign.
Arizona's soils are not Kenya's, but the mechanism is the same. A Kenyan block can be a red highland clay, a sandy loam near the coast, or a black cotton soil that shrinks and cracks, and no source in this list offers a calibration table for any of them. The texture a NuaSense dashboard shows for a site comes from external baselines, iSDA Africa at 30 metres and SoilHive from SoilGrids, fetched once when the station first reports its position. Those are modelled map values of around 2016 vintage. Treat them as a starting point for which curve the soil is likely to need, not as a soil test of your field. At installation, note by hand the texture of the soil that comes out of the hole, whether it is the same at both probe depths, and whether the irrigation water is saline. Those three notes decide whether the factory curve is close enough or whether the oven check further down is worth the afternoon.
Run the before, during and after test on the first irrigation
The first test a grower with a phone can run alone comes from the Arizona guide, which offers it as the practical alternative to laboratory calibration. Read the probe before irrigation. Read it again while water is being applied. Read it after the irrigation has finished. Treat the reading taken when the soil is visibly saturated as a near-saturation reference, and the pre-irrigation reading as a field-specific threshold. That is the whole method. It is the only installation-adjacent calibration in this source list that needs no oven, no balance and no laboratory. It is also the step most installations skip, because the probe is already sending numbers and numbers look like answers.
It works on any scale. NuaSense probes report relative moisture as a percent of sensor scale, not calibrated volumetric water content, and on that scale readings of 60 to 85 are normal. Across 15 NuaSense soil probes in Kenya over 02 October to 01 November 2026 the average was 69 percent of scale, with most readings between 42 and 86 percent, both depths pooled. Those network numbers are not field capacity and not a refill point. They are what a spread of Kenyan blocks happened to read in one month, and a grower who treats 69 as a target has borrowed somebody else's soil. The Arizona test gives you two anchors from your own ground instead. The piece on the three numbers you need to read a soil moisture trace set out why a reading without a field capacity and a refill point is a bare number, and this test is how those anchors get written down on the day the probe goes in.
Two cautions carry over. Saturation on a drip block is local: the soil is visibly saturated at the emitter and may be dry a hand's width away, so the saturated anchor only holds for a probe inside the wetted zone, which is why the spot was chosen first. And the dry-side threshold is wherever the block stood before that first run, not necessarily where you would want to irrigate next time. If rain had already wet the block when the probe went in, the pre-irrigation reading is a poor threshold and the test should be rerun after the soil has drawn down. Write the two anchors on the phone against the date and the depth. They are the reference every later reading is judged against, and they expire, which the failure section at the end returns to.
Read the first cycles for shape, not for a number
Once the anchors are set, readings arriving roughly every ten minutes from a LoRaWAN probe are read for their shape before their value. Good contact shows as a trace that rises during application, reaches the neighbourhood of the saturated anchor, then falls between irrigations as roots and evaporation draw the layer down. The deeper probe, if the run was long enough to reach it, rises later than the shallow one. If the run was short it may not move at all, which is information about the run, not a fault. Bad contact shows as a trace that does not respond to water the grower can see entering the soil, or that jumps to a value and holds it.
A flat line is the hardest case. The earlier post on readings that look wrong listed at least four explanations for one, from an air void to a dead battery, and nothing in this bank adds a fifth. What the first cycles can rule out is the void. A probe in good contact with soil that is being wetted will move, and a probe that stays put through a visible irrigation has either lost its contact or lost its link. Checking the station's own rainfall and temperature rows for the same hours separates the two, because a station reporting weather while the soil channel sits flat points at the hole and not at the radio. A trace that moves on the shallow channel and not the deeper one, through several runs, points at the run length or at the deeper hole, and a spade beside the probe after the next irrigation says which.
It helps to say who this reading is for. FAO's sensor installation and training work in Egypt put water level and EC devices at three sites in Al-Minya and three in Kafr El-Sheikh in July and August 2020. The devices logged automatically every hour, and 23 participants were trained: 14 engineers from Kafr El-Sheikh and nine from Al-Minya. That is a different user from a grower reading a phone on a small plot, and the engineers had reference instruments. The grower has the irrigation itself and the shape of the trace. That is enough to catch a bad hole. It is not enough to catch a wrong curve, which is what the oven is for.
If you need a real number, weigh a sample and dry it
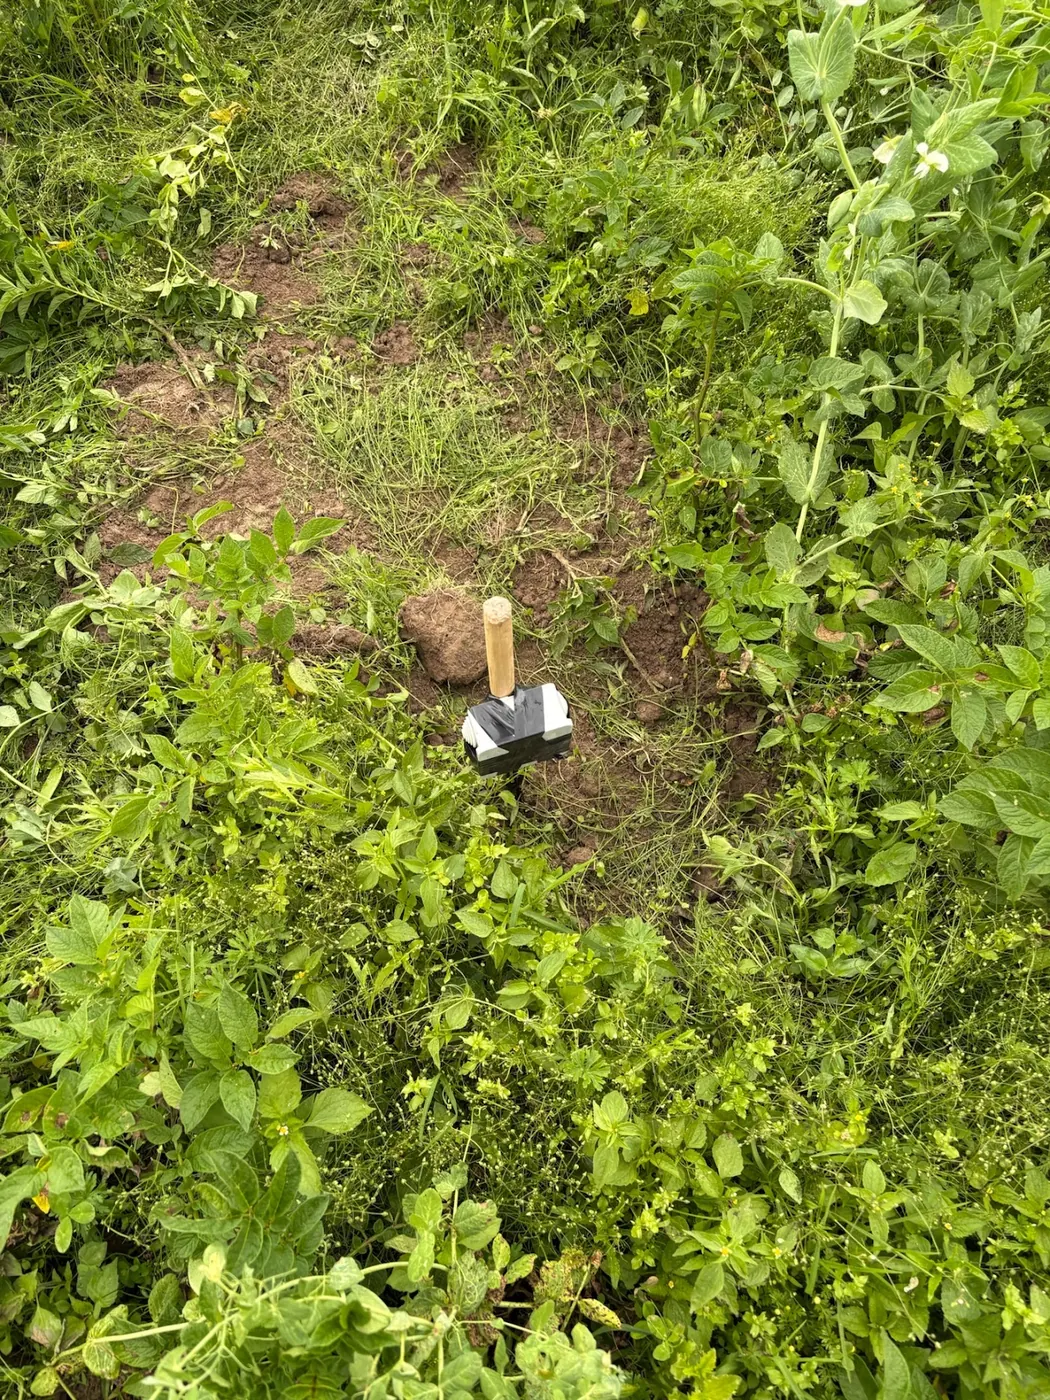
If the texture notes describe a soil the factory curve was never drawn for, one route gets you a real volumetric number. It costs an afternoon, not a laboratory. The Arizona guide describes the gravimetric reference: take a sample from beside the probe, weigh it, oven-dry it at 105 °C until the weight stops changing, then weigh again for the dry weight. Water lost divided by dry weight is the gravimetric content. Oregon State's bulletin gives the conversion: volumetric equals gravimetric multiplied by bulk density. For approximate field use, the Arizona guide puts bulk density at about 1.4 to 1.7 g/cm³ for sandy soils, 1.2 to 1.5 for loams and 1.0 to 1.3 for fine-textured or clay soils.
Work it once so the arithmetic is visible. Suppose a loam sample loses 0.20 grams of water for every gram of dry soil. Take 1.3 g/cm³ from the loam range. 0.20 multiplied by 1.3 gives 0.26 cm³ per cm³. That 0.20 is a made-up input to show the step, not a measurement; your sample gives your figure. The spread in bulk density is also the spread in your answer, so a clay worked with a sandy density is wrong by the ratio of the two.
Oregon State is clear that gravimetric sampling is labour-intensive and not real-time, which makes it impractical for routine irrigation decisions on most commercial fields. That is the right verdict for scheduling and the wrong one for installation. Do it once, note the probe's own reading at the same moment, and the oven number becomes the one point on the curve you know is yours.
What a site calibration is worth, measured on two soils
Site calibration has been measured on two soils, and the size of the payoff is the surprising part. In the AGRIS nine-sensor trial, site-specific calibration improved the estimate of total soil water by 45 percent in silt loam and the estimate of crop evapotranspiration by 17 percent. In loamy sand the same step improved total soil water by 42 percent, irrigation trigger prediction by 80 percent and crop evapotranspiration by 86 percent. Same sensors, same seasons. The sand gained far more on the number that matters for scheduling. The reason follows from the texture section: in the sand the factory curves were wrong in both directions, so there was more error to remove.
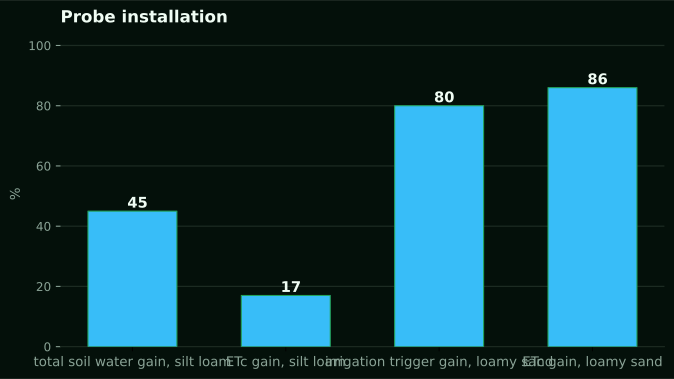
The trial also found that a sensor's ranking changed with the yardstick, and the authors say suitability depends on which target metric is chosen. For a grower that reads one way: judge a probe by whether it says when to start, because that is the decision. No Kenyan version of this table exists in the sources here. The trial's soils were silt loam and loamy sand; a highland clay or a coastal sand was not in it. What transfers is the direction and the order of magnitude: calibration on a coarse soil can change the trigger prediction by most of its range, and on a fine soil it changes it less. A grower with a sandy block has the strongest case for the oven afternoon. A grower on a loam with the Arizona anchors written down may reasonably skip it.
A colour instead of a number: what the simple probe costs
There is a second answer to the calibration problem: refuse the number altogether. The Virtual Irrigation Academy's chameleon sensor, as AICCRA describes it, is colour-coded: blue when the soil is too wet, green when moisture is adequate, red when it is too dry. It measures how hard roots have to pull water from the soil rather than a volumetric content, and reports no figure. Colours suit varying literacy levels. The tool set around it, the FullStop wetting front detector that shows when water has moved deep enough and so when to stop, nitrate test strips and a soil EC meter, is built for a farmer and not an engineer. The scale is real: VIA came to Africa in 2016 through a CSIRO and ACIAR partnership, ASARECA ran the first phase from 2015 to 2019 in Malawi and Tanzania, and by 2024 more than 87,000 sensors had reached partners in over 24 countries.
The incomes quoted from Kasese District in Uganda are a case study of a working installation, nothing more. Johny Benet Murangi and his son Dedan earned USD 8,276 in a year from 5.5 tons of maize and 6 tons of rice, which the source sets against a national smallholder average of USD 795; Ahmed Saturday earned USD 6,564 from one acre after USD 285 before. Two named farmers on a scheme with water in the canal. They are not an expected return for a Kenyan buyer.
The cost of that colour is everything the last section measured. You cannot site-calibrate a chameleon against an oven sample, and in the AGRIS trial calibration type alone shifted the scheduling estimate by 17 to 86 percent. AICCRA also points out the sensors are usually made in Southern Africa. That makes them hard and expensive to bring into Eastern Africa.
Which probe to buy, and who should buy nothing
The probe you put in the hole depends on one thing: is there a valve to open when it reads dry? AICCRA's count puts irrigated land in sub-Saharan Africa at less than five percent of cultivated land. So most Kenyan plots have no valve. On a rain-fed block a probe reports what the rain did. That helps a planting decision and does nothing for a watering one. For that grower the cheaper option is usually the right one. Oregon State puts the feel and appearance method within roughly 5 to 10 percent volumetric, depending on texture and operator skill. It costs a spade. If a plot cannot act on the reading, it should not pay for the reading.
If the block has water to apply, the equipment now enters the argument. A NuaSense soil sensor costs KES 7,000 excluding taxes. The two-moisture, two-temperature variant costs KES 9,000, and a version that also measures EC costs KES 10,000. It reads a shallow probe and a deeper one, sends roughly every ten minutes over LoRaWAN, and gets to the internet through a NuaSense weather station at KES 30,000 excluding taxes. That station also measures the weather. There is no separate gateway to buy. The station is solar powered, runs on a Safaricom SIM passed on at cost or on Wi-Fi for nothing, and payment falls due a month after it is transmitting. A full refund is available in the first three months. The NuaSense products page sets out the three steps the system is built around: data gathered in the field, intelligence applied, decisions delivered. It also shows which sensors sit in each.
Three growers should not buy it: one without irrigation, one with a small plot they can walk and use the feel method on, and anyone who wants calibrated volumetric water content. The probe reports percent of sensor scale, so the oven afternoon is still yours to do. The soil moisture sensor page describes the two-depth hardware for a reader who has decided the valve exists.
The ways an installed probe fails, in the order they usually show
Probes that are installed fail in a known order, and the Arizona guide lists the causes: battery failures, probe corrosion, mineral buildup, damaged cables, sensor displacement and wireless connectivity problems. Displacement is the one that undoes the hole. A probe moved by a hoe, a root or a settling trench loses the contact the first cycles confirmed. The trace after that belongs to a different soil. Cables come next. The guide wants them secured, batteries checked often or replaced by solar, a strong signal path, and dataloggers protected from wild animals and machinery. Goats and oxen are not in the Arizona text. They are the Kenyan version of it.
Drift is slower, and it is easier to mistake for a season. The same guide says sensors drift over time and need frequent recalibration to keep the data consistent. So the before, during and after anchors are not written once. Rerun them when the trace starts to disagree with the spade.
The last failure is one calibration cannot fix. In the Frontiers study built on 408 samples from 83 locations, a low-cost handheld sensor reached a root mean square error of 0.035 m³ m⁻³ in mineral soils, with a correlation of 0.90. That is close to the HydraProbe and ThetaProbe commercial sensors it was compared with, which were above 0.90. Soil-specific curves brought it to 0.031 for loam and 0.034 for sandy loam. In forest organic soil the error rose to 0.078 and the correlation fell to 0.80. That device is a research instrument, not something on sale. But the pattern is the warning: a calibration that holds on a mineral block does not carry to a high-organic bed, a heavily manured greenhouse soil or a drained wetland margin. Move a probe from one to the other and it needs its anchors again. A probe that reads sensibly in such a soil without them is reading luck.