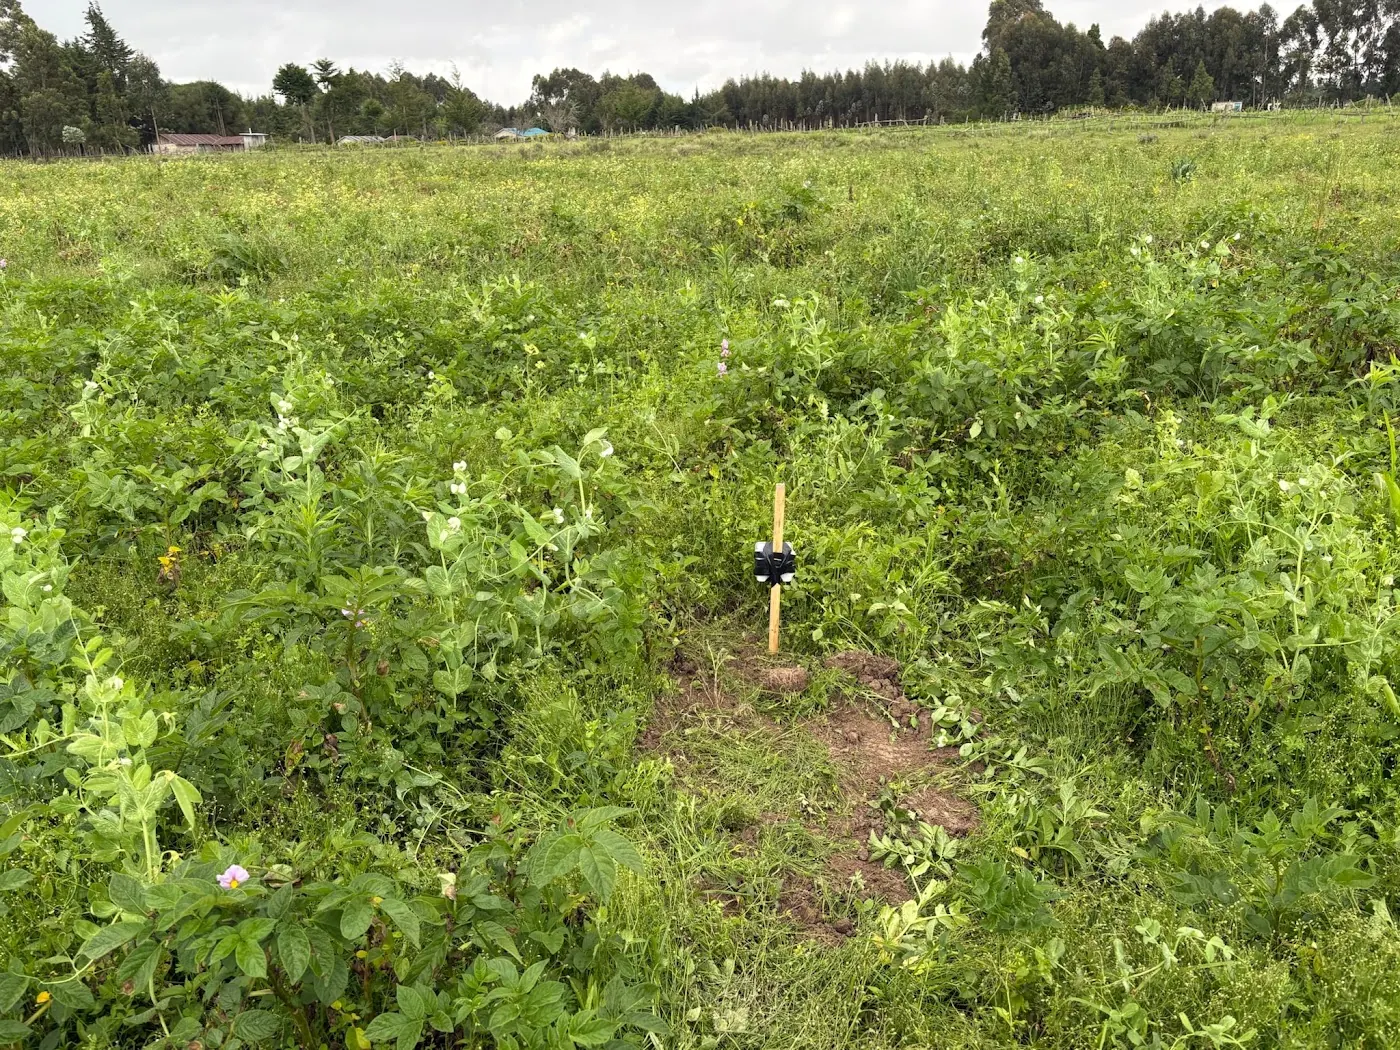
One probe, two depths, and they do not fall together
Thirteen NuaSense soil probes reported in Kenya between 16 October and 15 November 2026. Each probe carried two depths, and the soil temperature channels at those depths told different stories. At the steadier depth, temperature moved through 32.9 °C over the month. At the other depth it moved through 46.9 °C. That is a factor of 1.4 on the same probe, in the same hole. Moisture across both depths averaged 62 percent of sensor scale. Most readings fell between 26 and 87 percent. But a pooled average hides what matters for soil moisture depletion: the two channels did not fall at the same rate between irrigations. Nothing in the physics says they should.
This piece is built to break that expectation. A grower who buys a probe often pictures soil moisture depletion as one number falling, like fuel in a tank. In practice, the shallow probe and the deeper probe each have a daily fall. Those are two slopes, and the irrigation decision sits in the gap between them. When the shallow slope is steep and the deep slope is flat, the sun is taking water off the top and the roots have not reached the bottom. When both slopes match, the crop is drinking through the whole profile. When the deep slope is steeper than the shallow one, the roots are now below the shallow probe. The top reading has stopped being the one to watch.
None of that needs a calibrated millimetre figure. You need a line drawn through the days since the last irrigation, on a phone screen. You also need to look at both depths before deciding which one is telling the truth this week. Everything below is about what bends that line, and how to read the bend.
All figures above come from NuaSense instruments over 16 October to 15 November 2026, aggregated across the network. Moisture is percent of sensor scale, not volumetric water content. No station or probe is named, and no figure here describes a region.
What a daily fall is made of
A reading drops for two reasons. They leave different marks on the chart: evaporation from the surface and the crop pulling water through its roots. As soil dries, according to the Oregon State Extension guide to soil moisture monitoring for irrigation scheduling, the largest pores drain first. Water remains in progressively smaller pores, the films around particles get thinner, and the energy a root must spend to pull water out rises. That guide lists three things a moisture measurement can tell you: how much plant-available water remains in the root zone, how quickly it is being depleted through evapotranspiration, and when irrigation is needed before the crop is stressed. Number two is the slope.
The first day after an irrigation is usually the steepest and the least informative. Large pores are emptying by gravity. A probe falling fast in that window says nothing about crop demand. You want the slope after drainage settles, when the atmosphere and the plant drive the fall. Which of the two takes the water decides where the fall shows up. A shallow probe on bare soil between seedlings mostly reads the sun. A deeper probe under a closed canopy mostly reads the crop. Their ratio is a crude but honest picture of which process is in charge. It changes week by week.
Weibei orchards: depletion moved deeper as the trees aged
The best single illustration of a slope that moves with crop stage comes from the Loess Plateau. It was not measured with a probe at all. A study of soil water depletion in rainfed apple orchards in Weibei, Northwest China sampled the 0 to 150 cm profile monthly from March to September 2019 by oven-drying. It covered orchards aged 7, 13 and 22 years and long-term winter wheat fields. Young orchards showed no desiccation at all. Mature and old orchards showed mild desiccation at 0 to 80 cm in mid-June. Across the season the picture stepped downward: mild at 0 to 60 cm from mid-April to mid-May, intense through the full 0 to 150 cm in mid-June, moderate at 20 to 150 cm in mid-July. Water stress in the old orchards was confined to 0 to 70 cm in mid-June. Wheat fields were stressed from mid-May to mid-July. Its authors drew the distinction this article rests on: when evaporation dominates, depletion sits in the upper layers. When transpiration dominates, it concentrates where roots are dense.
Read that sequence as a slope. In the young orchard, the fall sat near the top and stayed shallow. As trees aged and roots filled the profile, the fall moved down and lasted longer. By mid-July the top 20 cm had recovered, while everything beneath it was still being drawn down. A single shallow probe in that old orchard in July would have reported a recovered soil. Below it, the crop was still drinking.
Let us be plain about what carries over to Kenya. Those were rainfed trees on deep loess, sampled once a month with an oven. An avocado, macadamia or coffee block on red volcanic soil under drip, read every ten minutes, is a different system. The 150 cm profile and those particular months do not carry across. The direction does. As a perennial ages, the layer with the steepest daily fall sinks, and a probe depth you chose in year one may be reading the wrong layer years later.
The slope at establishment, at full canopy, and after harvest
Annual crops tell the same story, only faster. In French beans or tomatoes just after transplant, the shallow probe does nearly all the moving. The deeper probe barely stirs between irrigations, because the roots are not there yet. At this stage a steep shallow slope is evaporation. Ask whether an irrigation that refills only the top is being spent to feed the sun.
Once the canopy fills in, the deeper probe wakes up. Roots pull from the layer they have reached, leaves shade the surface, and the shallow slope often flattens against the deep one even though total water use has gone up. Watch only the top reading now and you will over-irrigate, because the shallow number looks calm while the deeper one is doing the work. The bounds for each crop are set out in the piece on the soil moisture band each crop wants. The slope tells you how fast you are travelling toward the lower bound.
After harvest the deep slope goes flat again. That flattening is a reading in itself. A deep probe that stops falling says the roots that drank from it are gone, and in a perennial it can say the same after waterlogging or a hard pruning. No source in the bank gives you a Kenyan table of slope by crop stage, so build your own. Note both daily falls at transplant, at flowering and at peak harvest for one season. Then you own the only table calibrated to your soil, your emitter spacing and your probe depths.
Weather bends the slope: ET0 at 1.4 mm a day
Air sets the ceiling on how fast water can leave. At 16 NuaSense stations between 16 October and 15 November 2026, reference evapotranspiration computed hourly with FAO-56 averaged 1.4 mm per day. That is reference ET0 for a well-watered grass surface, not crop water use. It was also a cloudy, wet-leaved stretch: 34 percent of station-hours were recorded as leaf-wet, about 8.3 hours in an average day, and relative humidity averaged 74 percent. Vapour pressure deficit, the drying pull of the air, averaged 0.72 kPa but peaked at 4.17 kPa. Air temperature ranged from 0.0 to 41.6 °C around a mean of 19.2 °C. A mean describes nobody's afternoon. The peak is what the shallow probe feels.
On a day near that VPD peak, the shallow slope steepens sharply while the deep slope barely notices. Evaporation works at the surface, and transpiration answers the same dry air only through the layer the roots occupy. On a day near the mean, the two slopes converge. Draw one straight line through a week that holds both kinds of day and the slope is wrong on every day of that week. So draw the line through the last few days only, and redraw it when the weather turns.
Rain resets the line entirely, and it falls unevenly. Station totals for the same month ranged from 0.0 mm to 143.2 mm across 15 stations that are not co-located, and only 3.4 percent of ten-minute readings recorded any rain at all. For the grid cells our stations sit in, the CHIRPS satellite-and-gauge record gives a 43-year average November rainfall of 119 mm, a driest of 52 mm in 2025 and a wettest of 288 mm in 2019. A slope after an irrigation in a 52 mm November and in a 288 mm November is the same physics with a different starting point. In the second case, drainage rather than the crop dominates the chart for longer.
Three layers, one average, and a drought count that ran 128 percent too long
The strongest case for reading two depths separately comes from a global study, not a farm. A Nature Geoscience analysis of multilayer soil moisture depletion split the profile into 0 to 10 cm, 10 to 40 cm and 40 to 100 cm, and defined vertically compound drought as all three layers dry at once. Across global vegetated regions in warm seasons from 1981 to 2020, that compound state averaged 6.0 plus or minus 1.7 days a year and 28.5 plus or minus 9.0 percent of all drought days. Surface-only drought averaged 4.5 plus or minus 0.7 days and 19.0 plus or minus 2.4 percent. Deep-only drought averaged 4.4 plus or minus 1.0 days and 18.4 plus or minus 3.0 percent. Layers dry alone far more often than they dry together. Based on ERA5-Land, more than half of land regions showed upward trends in the duration of all three types.
Here is the finding that should change how you read a dashboard. When the analysts diagnosed drought from average moisture across the whole profile, they overestimated how long compound drought lasted by about 128.3 percent. At the same time they underestimated the ecosystem losses tied to it by about 27.8 percent. The average made the soil look in trouble for more than twice as long as it was, and it still missed a quarter of the damage. The same study points out that plants with shallow and deep roots keep pulling from whichever layer still has water. A deficit in one layer does not by itself make the whole profile dry. Deep-layer drought also showed up more strongly than surface drought over southern Africa.
Those figures come from reanalysis on a global grid, not from Kenyan fields. There is no Kenyan drought-day count in the bank. What a Kenyan grower can take from it is the shape of the error. If you pool the two depths on a probe into one number, you repeat on a single bed the mistake that study measured across continents. Our own pooled figure of 62 percent of scale describes a network. It is not a trigger for anyone's pump. Two lines on the chart, not one.
Percent of scale, not millimetres
If you are used to American extension material, you will want the slope in millimetres of water. Oregon's guide gives the worked case. A volumetric water content of 0.25 cm³/cm³ through a 12-inch root zone holds 0.25 multiplied by 12, which is 3 inches of stored water. Field capacity sits at roughly minus 10 to minus 33 kPa depending on texture, and permanent wilting point is where plants cannot extract enough water to recover. In those units, a slope compares directly with ET0.
NuaSense probes cannot give you that. Better to say so than to fake it. Our sensors report relative moisture as percent of sensor scale, where readings of 60 to 85 are ordinary. Writing those readings as cubic metres per cubic metre would be wrong. Our slope is percent of scale per day, and its value is relative. The fall today is steeper or flatter than last week on the same probe in the same soil. That is exactly the comparison the decision needs. Three anchors give a relative reading meaning, and the post on the three numbers you need to read a soil moisture reading worked them through: the reading after a full irrigation has drained, the reading where the crop first shows stress, and the reading today. Texture shown alongside comes from an iSDA Africa map of around 2016 vintage. It is a modelled baseline, not a test of that field. Use it to judge whether a steep slope is plausible, not as a calibration. Nothing on the soil moisture sensor page promises millimetres.
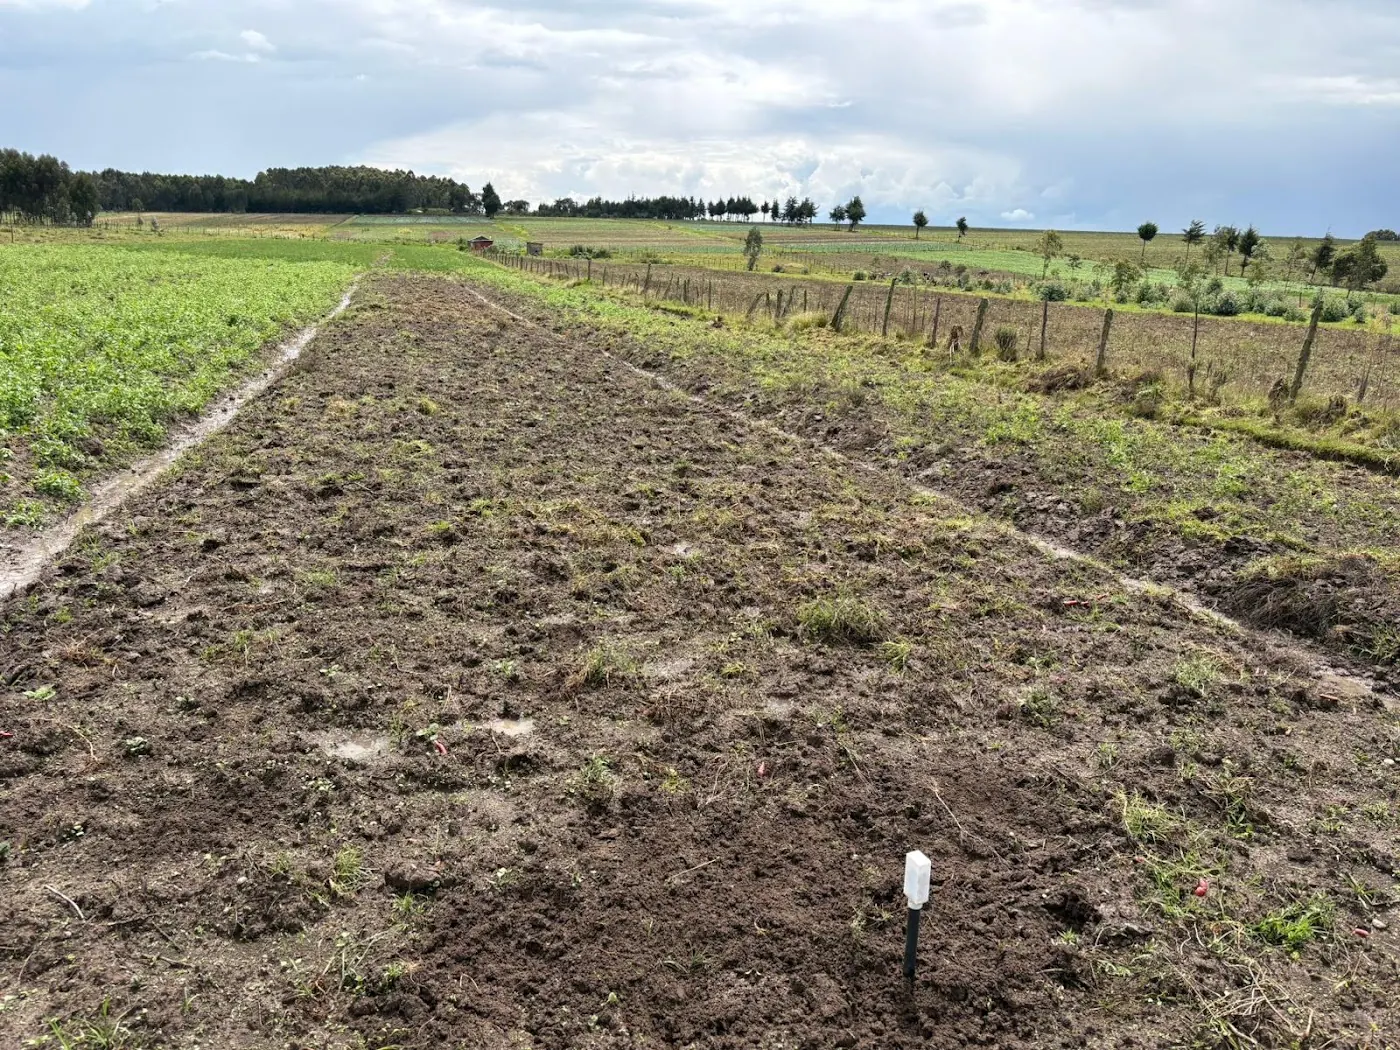
The stop line: turning a slope into a day
A slope becomes a date only after you decide how much depletion you will allow. A basin-scale model shows why that choice matters more cleanly than a field trial. An AGRIS record of an irrigation demand assessment for India's Damodar basin compared two scenarios. One was a zero-allowable-depletion scenario, so irrigation started the moment any deficit appeared. The other allowed 50 percent depletion before irrigating. Allowing 50 percent cut modelled irrigation demand by 1966 million cubic metres. Under that scenario, annual demand still swung between 8923 million cubic metres in 2015 to 2016 and 6344 in 2013 to 2014. Rabi-season deficits were almost constant from 2009 to 2018, while Kharif-season deficits varied year to year. The dry season behaved like a schedule; the wet season did not.
That is a model of a river basin, not a Kenyan recommendation. The 50 percent is the scenario the authors tested, not a threshold any grower here has been told to use. Only the idea transfers. Pick a stop line on your own probe scale from the stress reading you saw on your own crop. Then the arithmetic uses three numbers from the chart: today's reading, minus the stop line, divided by the daily fall over the last few days since drainage settled. Out comes a number of days. Write the three inputs in the same place every time. When the answer is wrong, you can see which one moved.
It is an estimate. It is honest only within limits the bank states plainly. Slope alone, without texture, root depth and a chosen threshold, does not give an exact irrigation date. It gives a day to check again. On a block with two soils, that day differs on each soil. That is why the probe count argument on this site turned on soil boundaries rather than acreage.
A crust, a disc, and a cover that failed
Every slope assumes the water you applied went into the profile where the probe is. Two things at the surface break that assumption. First, runoff. An FAO chapter on minimising water stress and improving infiltration sets out when runoff happens: rainfall intensity exceeds the infiltration rate, or pores are already full because the soil is shallow, has low water-holding capacity or sits on a slowly permeable subsoil. Any of those gives a chart with a small bump after a heavy event and then the same slope as before, because most of the water left as surface flow. Second, the reflex to break a crust with a disc or tined pass. That same chapter advises against regular shallow tillage for this purpose. The gain in porosity is temporary, discs often cause compaction underneath, and tillage speeds up the loss of organic matter. On the chart, that shows as a shallow channel that briefly looks responsive and a deeper channel that stops filling. In El Salvador's Guaymango area, farmers told FAO that after 1973 conservation recommendations including no burning and residue distribution, they harvested almost as much maize in the 1997 El Niño drought and did not lose crops in Hurricane Mitch the following year. Same rain, different amount stored.
Kenya has its own version of this, with limits. An ILRI trial on reducing soil erosion on smallholder farms in Western Kenya put Calliandra at the lowest runoff of the treatments, 11.6 to 17.2 mm per hectare, and the lowest erosion, 31 to 446 kg per hectare per season. It also had the highest infiltration. Earthworm counts came to 229 per square metre under Mucuna and 165 under Calliandra. Lablab caught disease and posted the highest erosion over the last two seasons. Runoff, erosion and infiltration were what that trial measured. It did not measure probe readings or irrigation timing, so the step from infiltration to slope is this article's reasoning, not that study's result. Lablab is the warning. A cover that fails changes infiltration, and your probe will show you that change before you spot the disease.
The hand test, the satellite pixel, and whether to buy anything
Most of Kenya was never measured in the ground. Keep that in mind for any reading here. A systematic review of soil moisture research in Kenya screened 847 records and included 63 studies published between 2000 and 2026: 54 percent remote sensing, 29 percent in-situ, 17 percent modelling. Forty-one percent of the work sat in the central highlands and Mount Kenya region, and 18 percent in the arid and semi-arid lands. Those ASALs cover about 89 percent of Kenya at under 700 mm of annual rainfall, and carry about 36 percent of the population and 70 percent of the livestock herd. Few studies reached operational advisory use, and subsurface dynamics are named as a gap. A grower with two probe depths on a block in the ASALs holds a dataset the published literature mostly lacks.
Satellite products in that review are no substitute for a slope. SMOS, launched in 2009, and SMAP, launched in 2015, resolve soil moisture at 25 to 50 km. ASCAT works at about 12.5 to 25 km, and Sentinel-1 radar at 10 to 20 m. All of them are affected by vegetation, roughness and interference. A free app colouring your area is showing a cell that may contain a town, and it cannot see the deep layer at all.
Older than any of this is the no-purchase check. Oregon's guide puts the feel-and-appearance method within roughly 5 to 10 percent of volumetric moisture, depending on texture and operator skill. Say you farm one small block, irrigate daily on drip, and can dig at the wetted edge on each visit. For you that method and a notebook give a slope good enough to act on, and buying nothing is the right call. A probe earns its place when the block is too large to dig daily, when the deep layer is the question, or when the decision is made from a phone away from the field. A NuaSense soil sensor costs KES 7,000 excluding taxes and needs a weather station at KES 30,000 to carry its readings; the variant with two moisture and two temperature channels is KES 9,000. The station is the larger cost, so the case rests on wanting ET0 and rain alongside the slope.
Monday: both depths, one line, and the irrigation you skip
Here is what changes on Monday for a grower who already has a probe. Open the chart for both depths, not the pooled figure. Find the last irrigation and ignore the first day after it. That fall is gravity. From the second day onward, draw a line through each depth to today and write down three things: the shallow daily fall, the deep daily fall, and which is steeper. Steep on top and flat below means the crop is young or the surface is bare. Refilling the top every day is feeding the sun. If the deep slope has started moving, the roots have arrived and the shallow reading has become a weather gauge.
Then dig once, at the wetted edge, and feel the soil at both depths against what the probe says. A hand test is coarse, within 5 to 10 percent by the Oregon figure. But a probe reporting a dry deep layer over soil that is visibly wet at that depth has told you something about the installation, not the crop. Mark your stop line from the reading at which you last saw stress, then run the subtraction: today's reading minus the stop line, divided by the deep daily fall. If that day is further away than the next scheduled irrigation, skip the scheduled one and watch the slope instead. That skipped irrigation is the first thing the probe pays for.
If you are still deciding whether to have a probe at all, the overview of smart irrigation in Kenya on the NuaSense blog covers drip and gravity kits, soil sensors and solar pumping side by side. That is the right place to weigh the whole system before pricing one part of it. For everyone else, carry the slope into the week: redraw it when the air dries, reset it when the rain comes, and read each depth separately. The layers dry on their own schedule, and the average has already been shown to lie.